Self-hosted server monitoring, deployed in minutes.
A single Hub, one lightweight agent per host. Live metrics every 30 seconds, package inventory updated daily, threshold-based alerts by email or webhook.
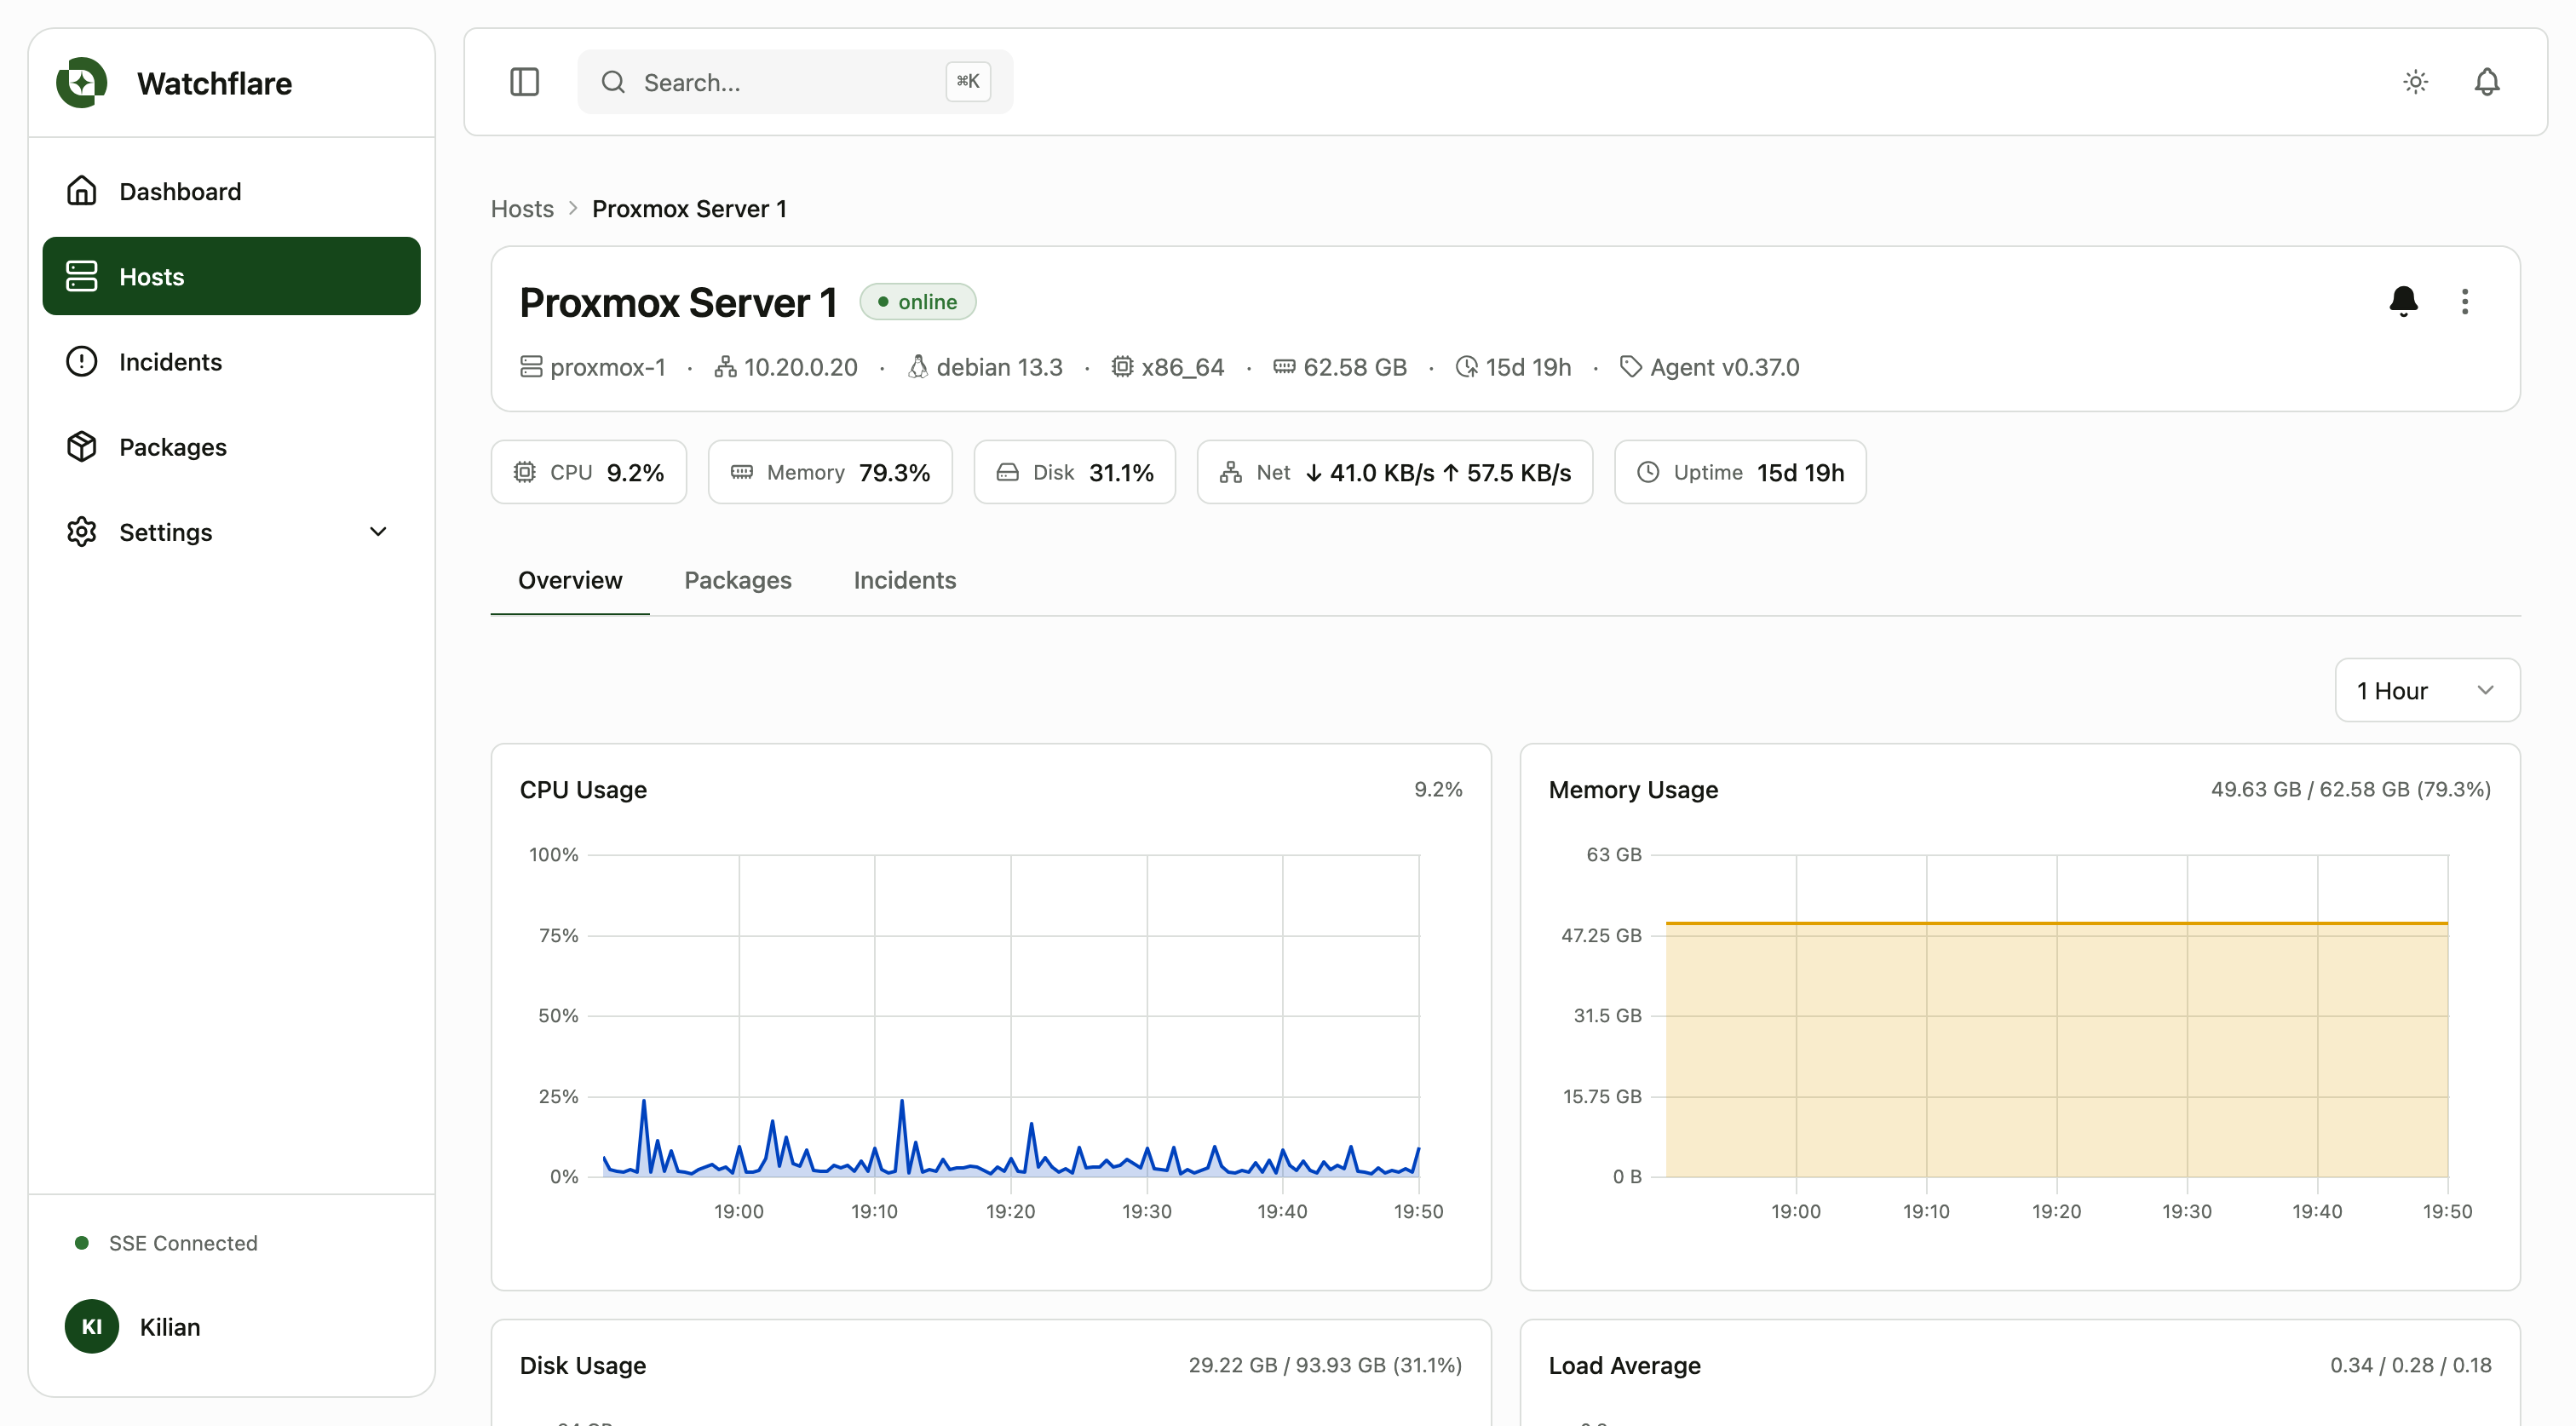
CPU Usage
34.2%Memory Usage
6.1 GBDisk I/O
R: 4.8 MB/s / W: 1.2 MB/sNetwork
↓ 1.4 MB/s / ↑ 0.6 MB/s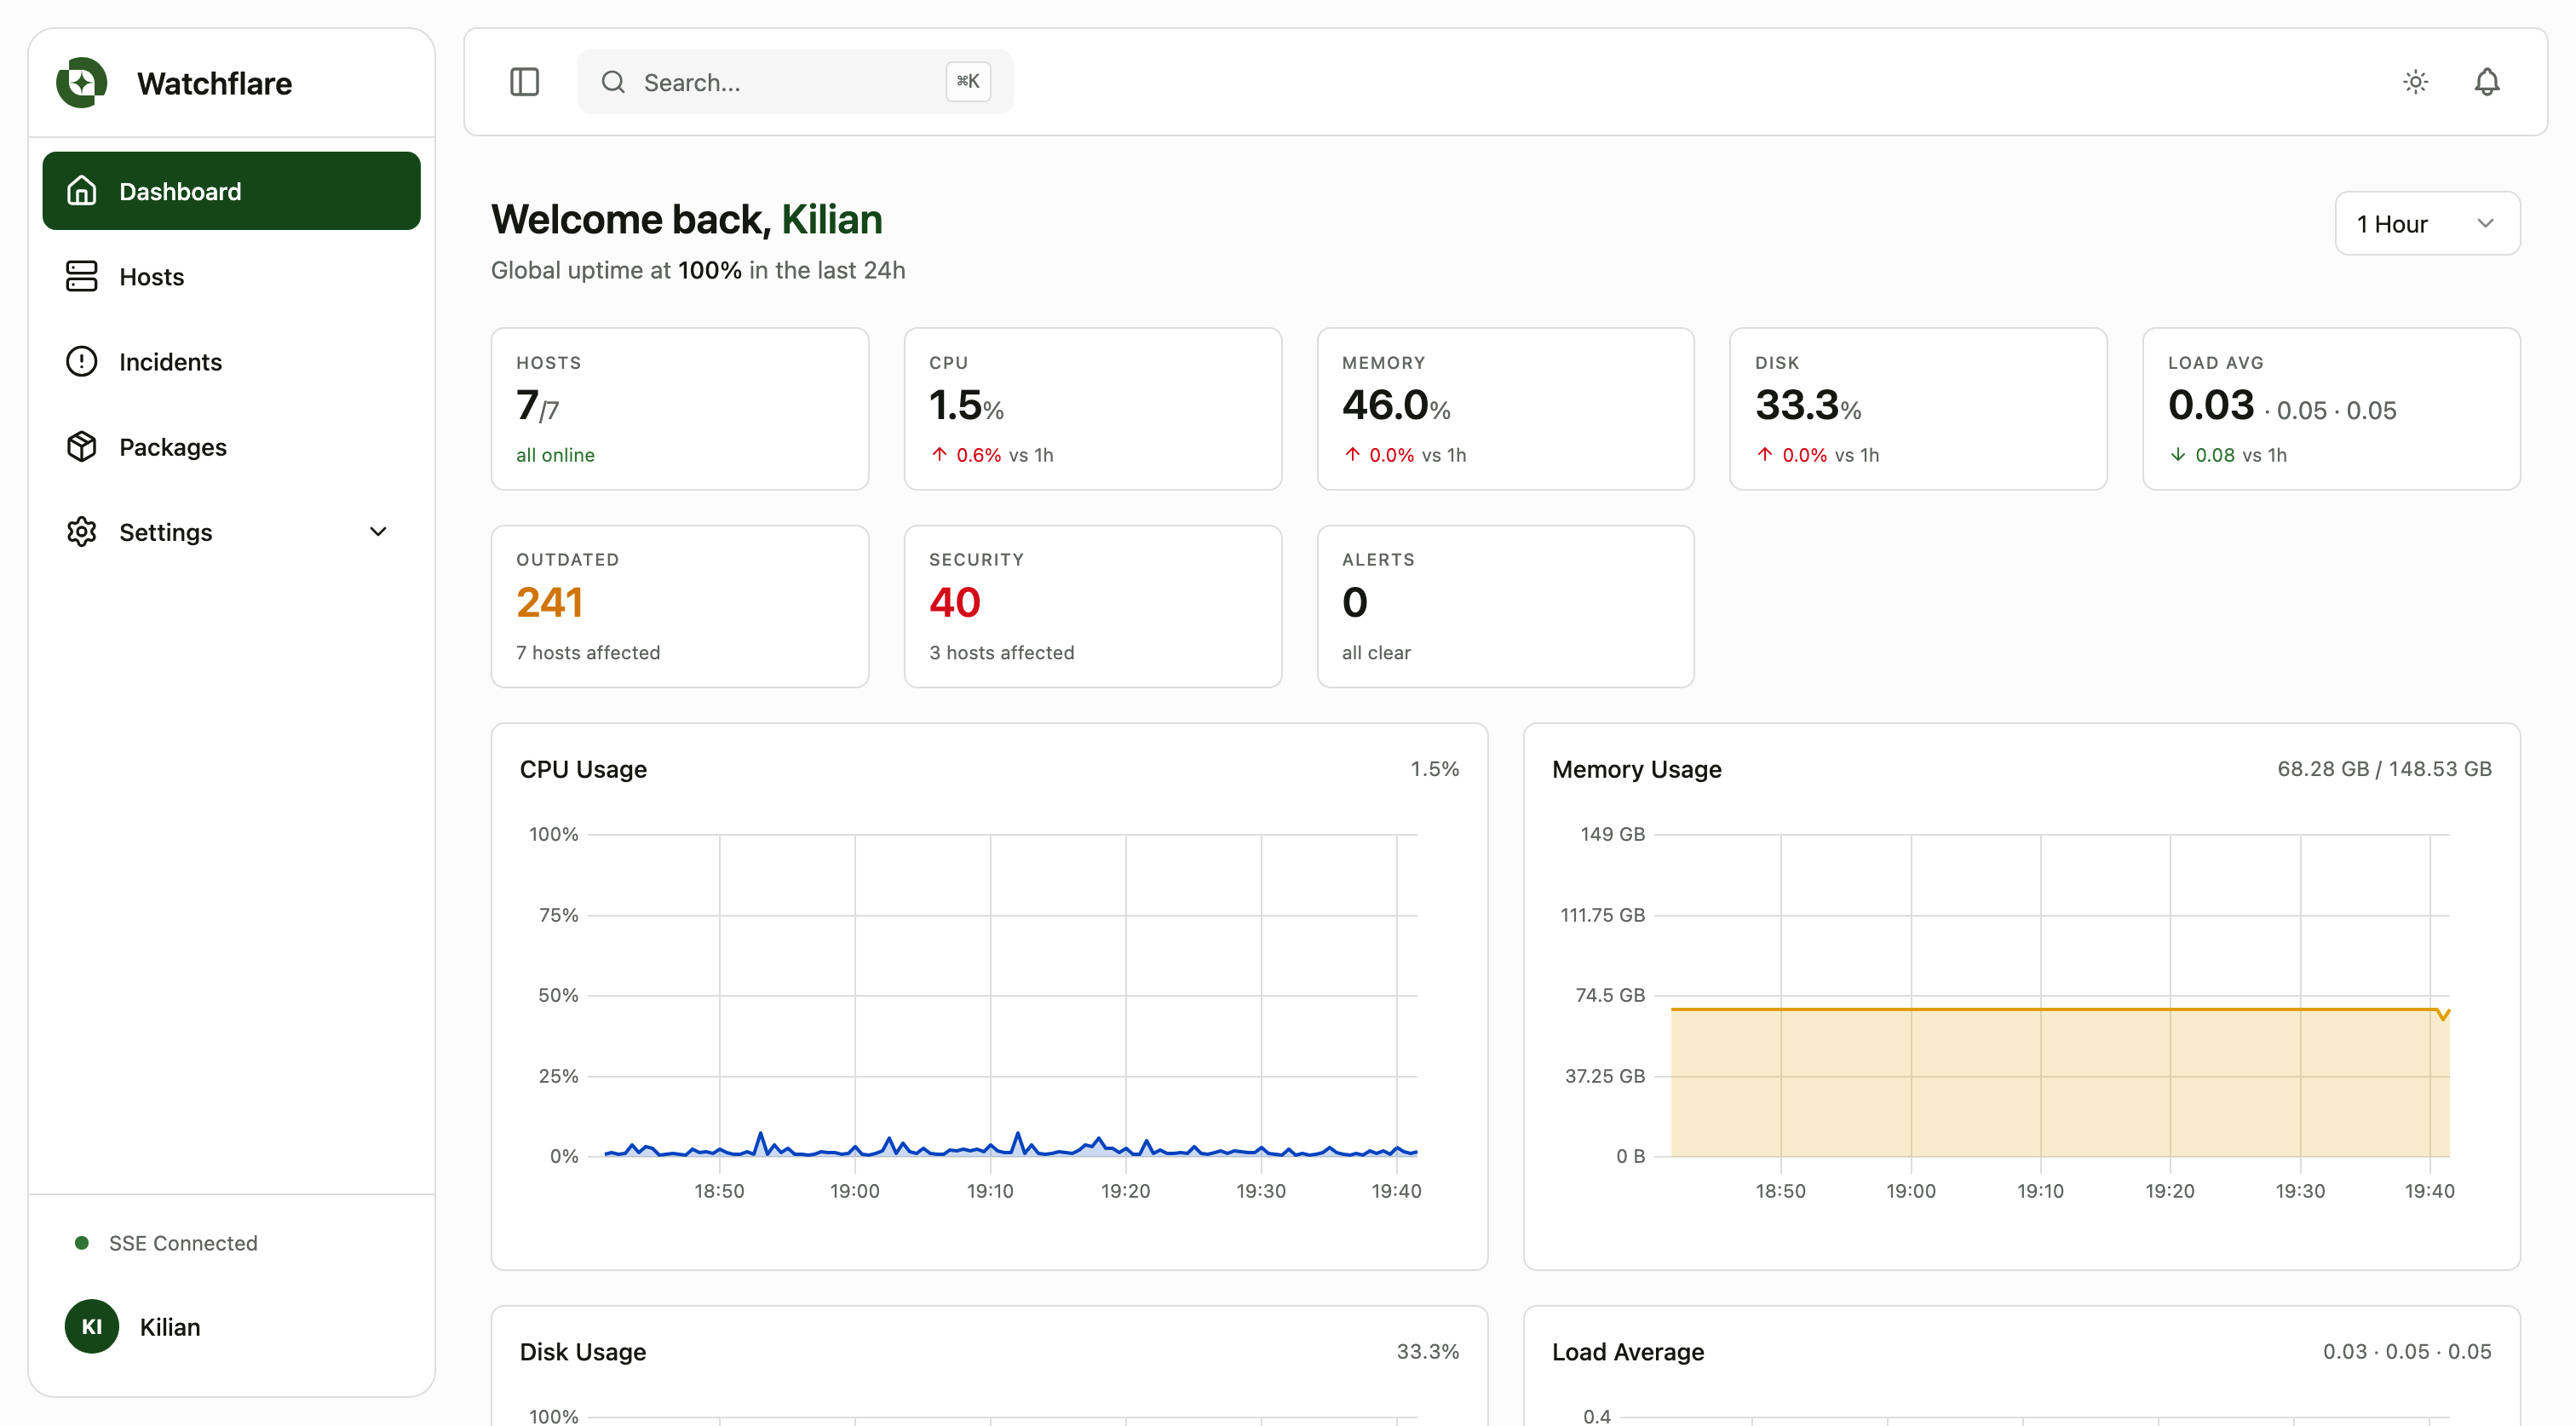
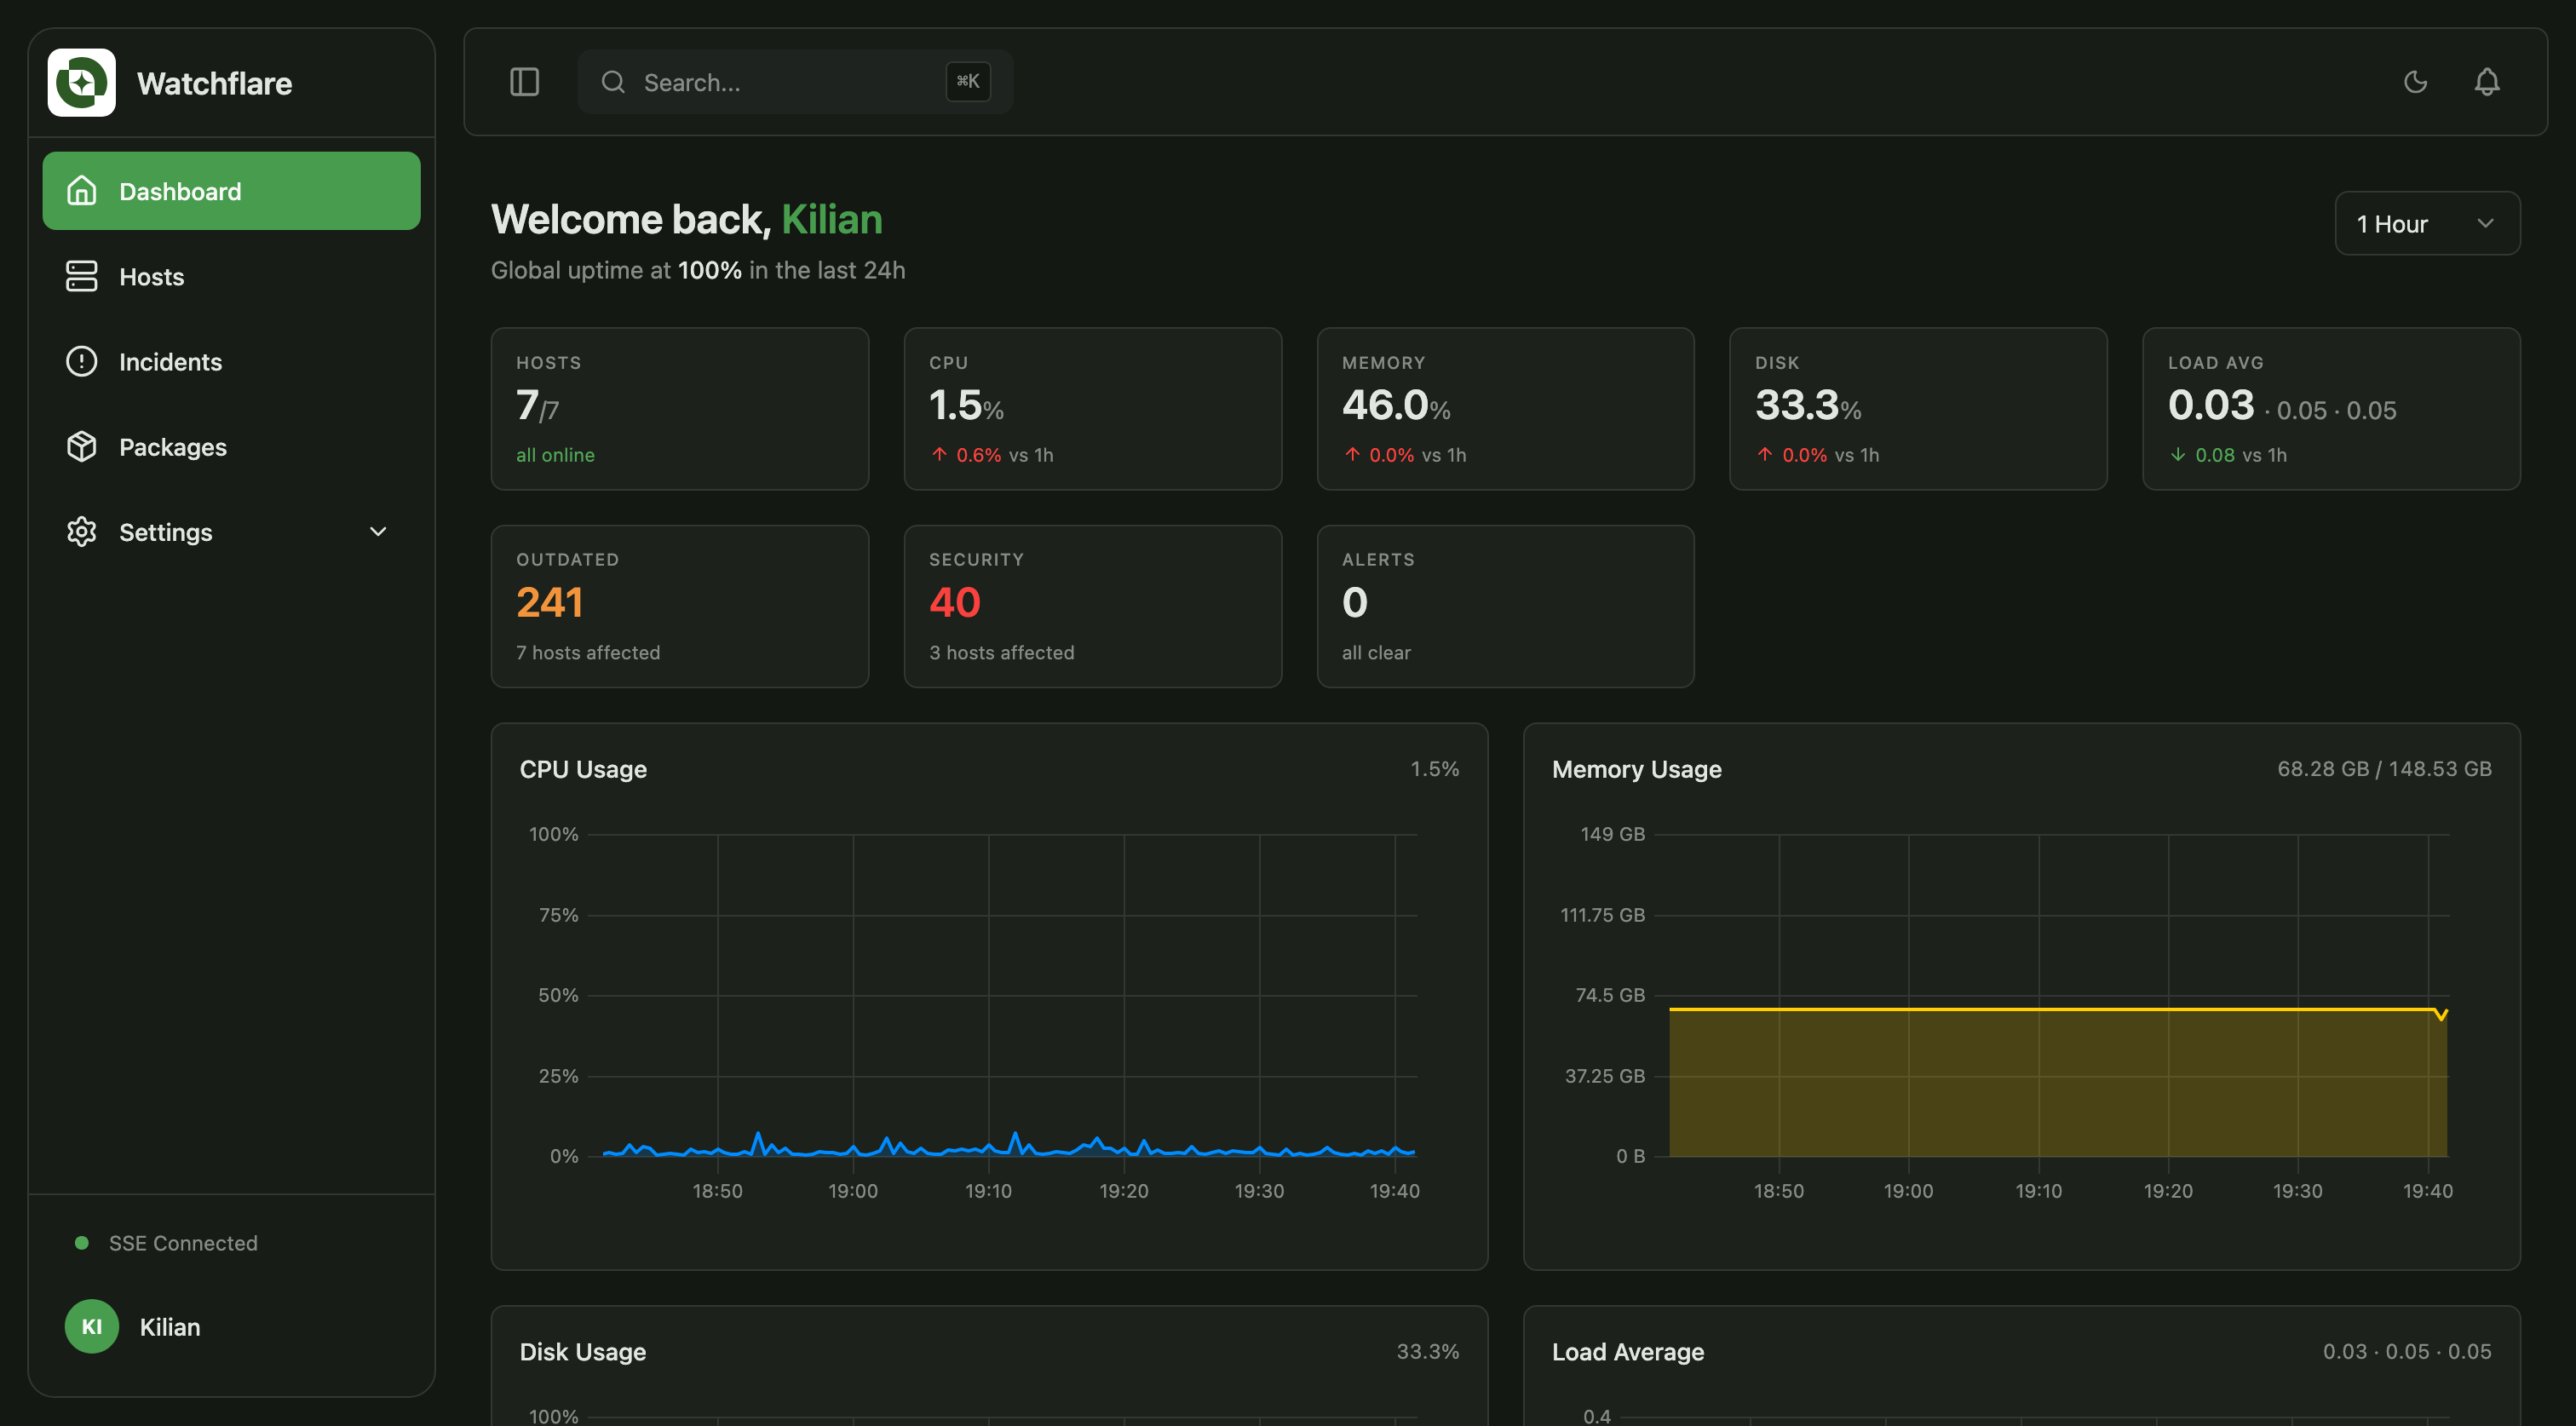
Everything you need to keep an eye on your servers.
Live metrics, container telemetry, package inventory, and threshold alerts. Collected every 30 seconds by a lightweight agent and centralized in a single Hub.
Real-time streaming
CPU, memory, disk, network, load average, temperature, disk IO, swap. SSE on the Hub side, gRPC on the agent side. Live updates without client-side polling.
Container metrics
Per-container CPU, memory, and network via the Docker or Podman API. Opt-in: one option at install, nothing to add inside your containers.
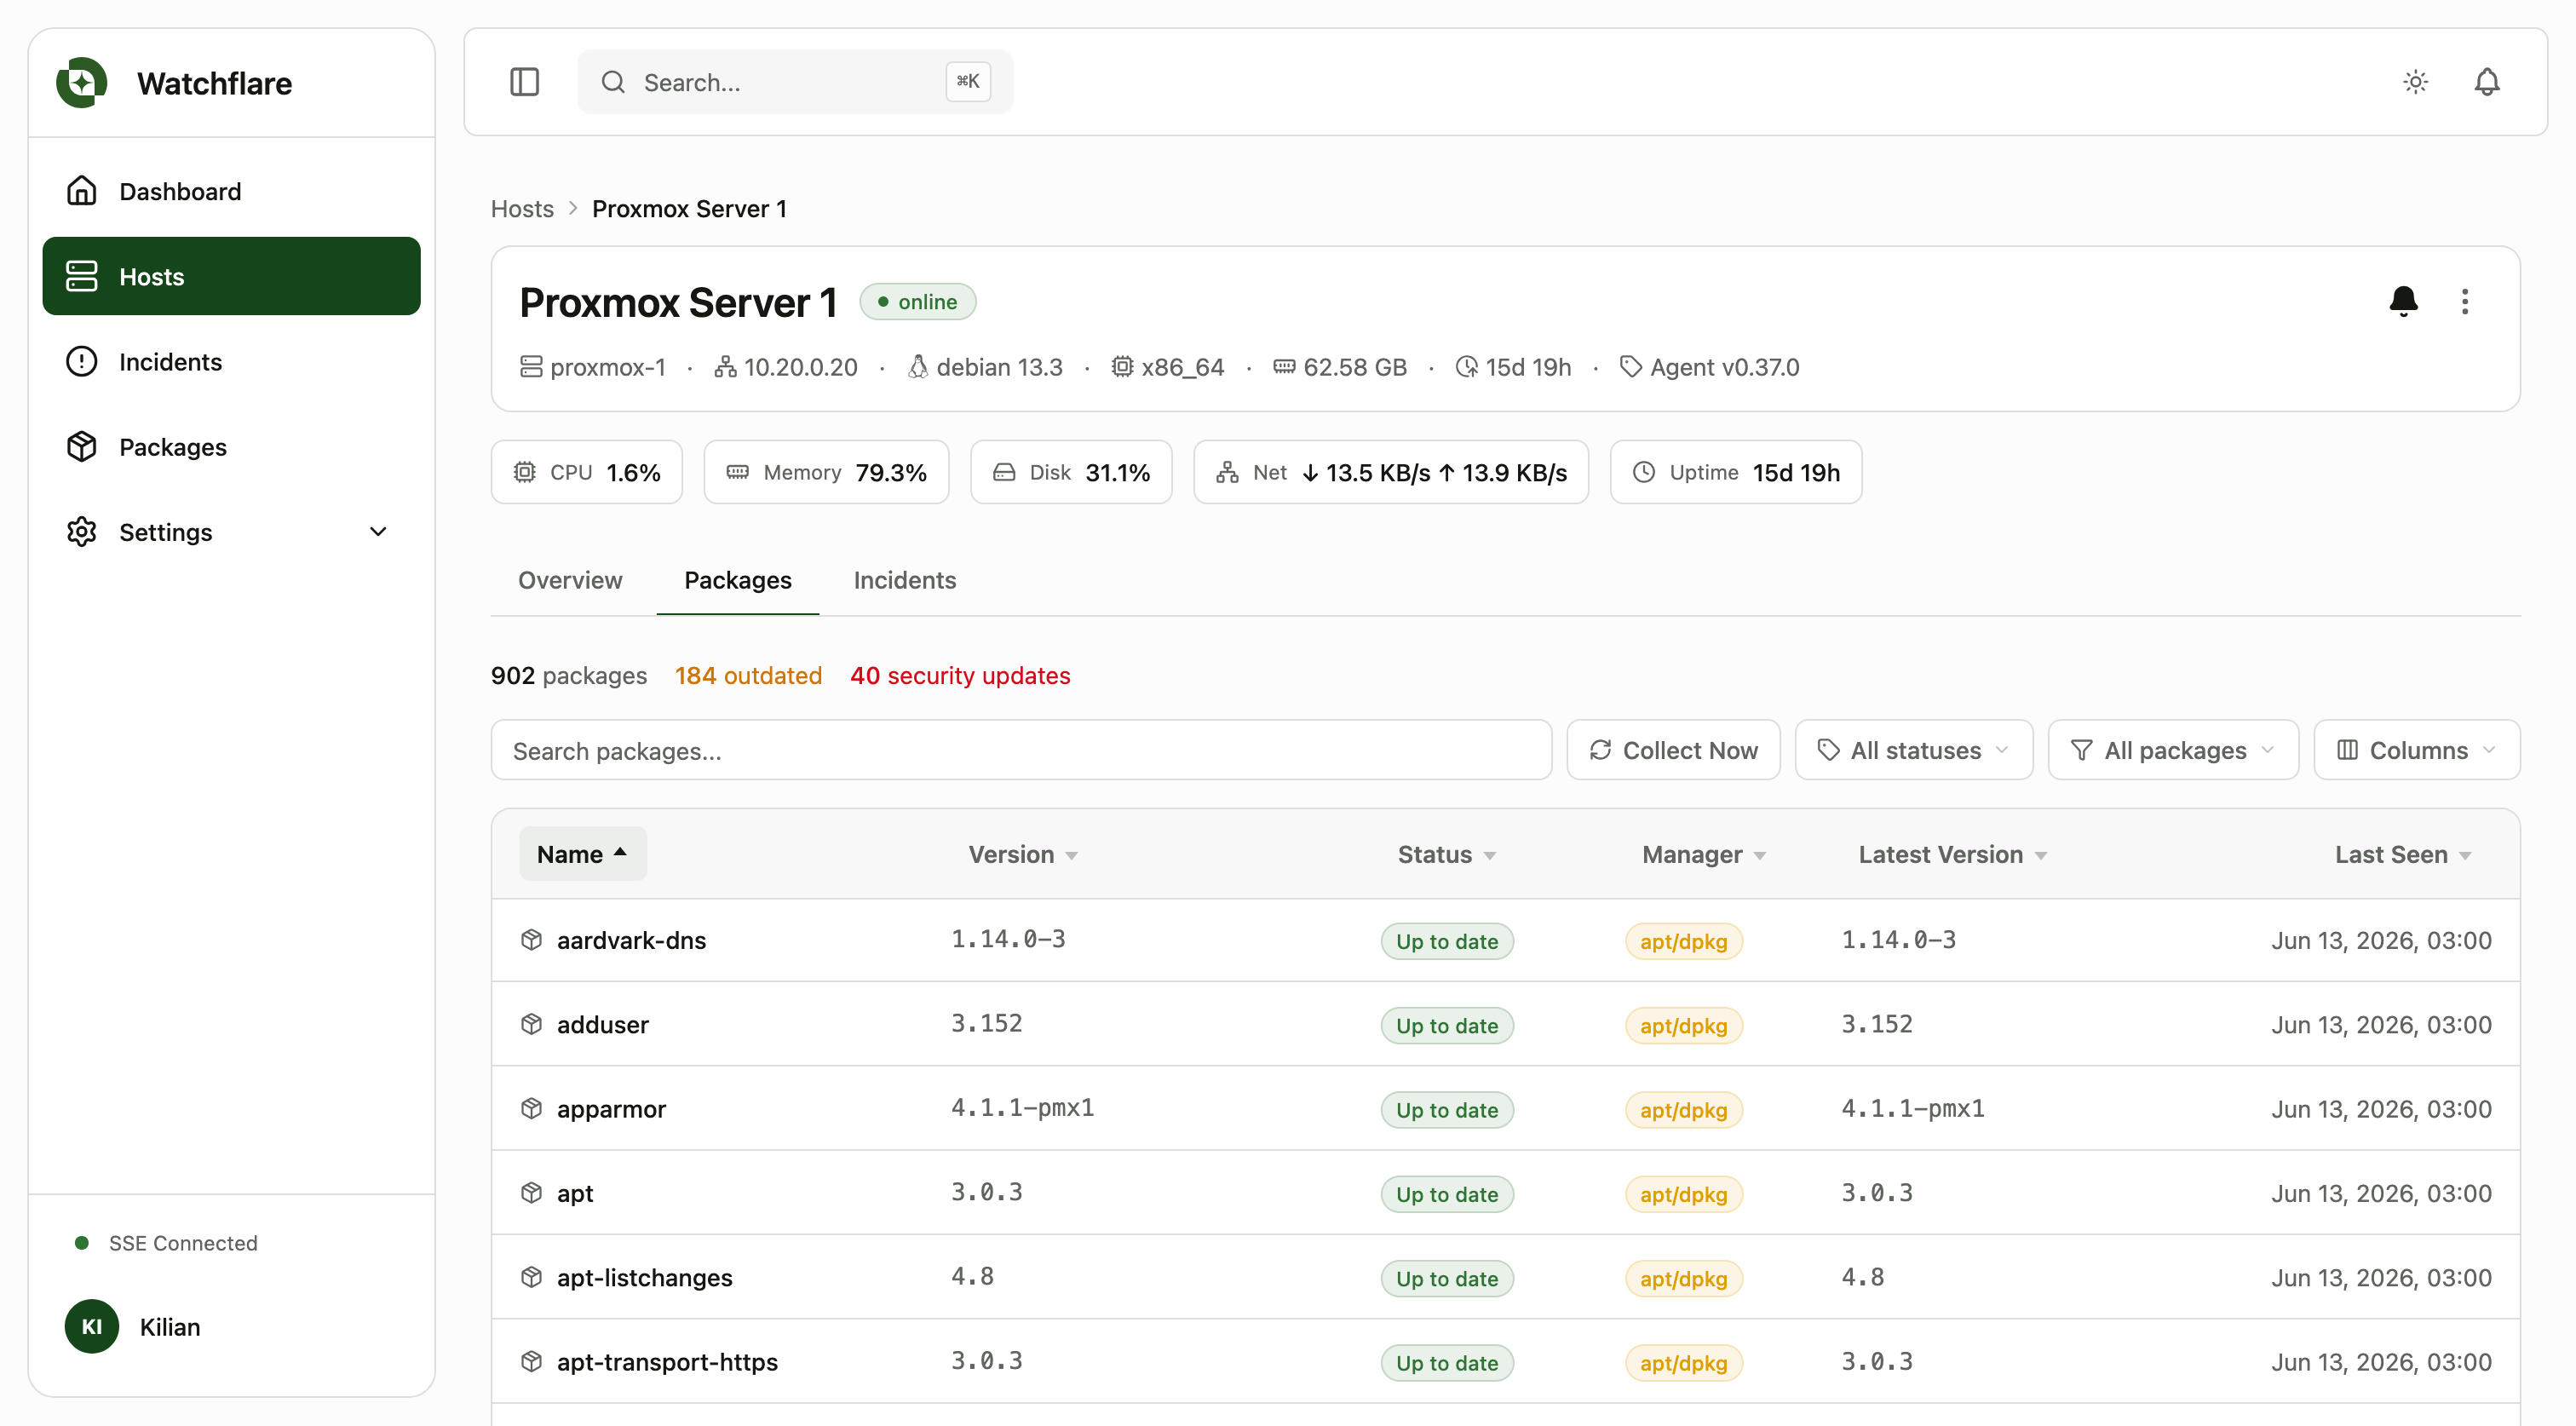
Package inventory
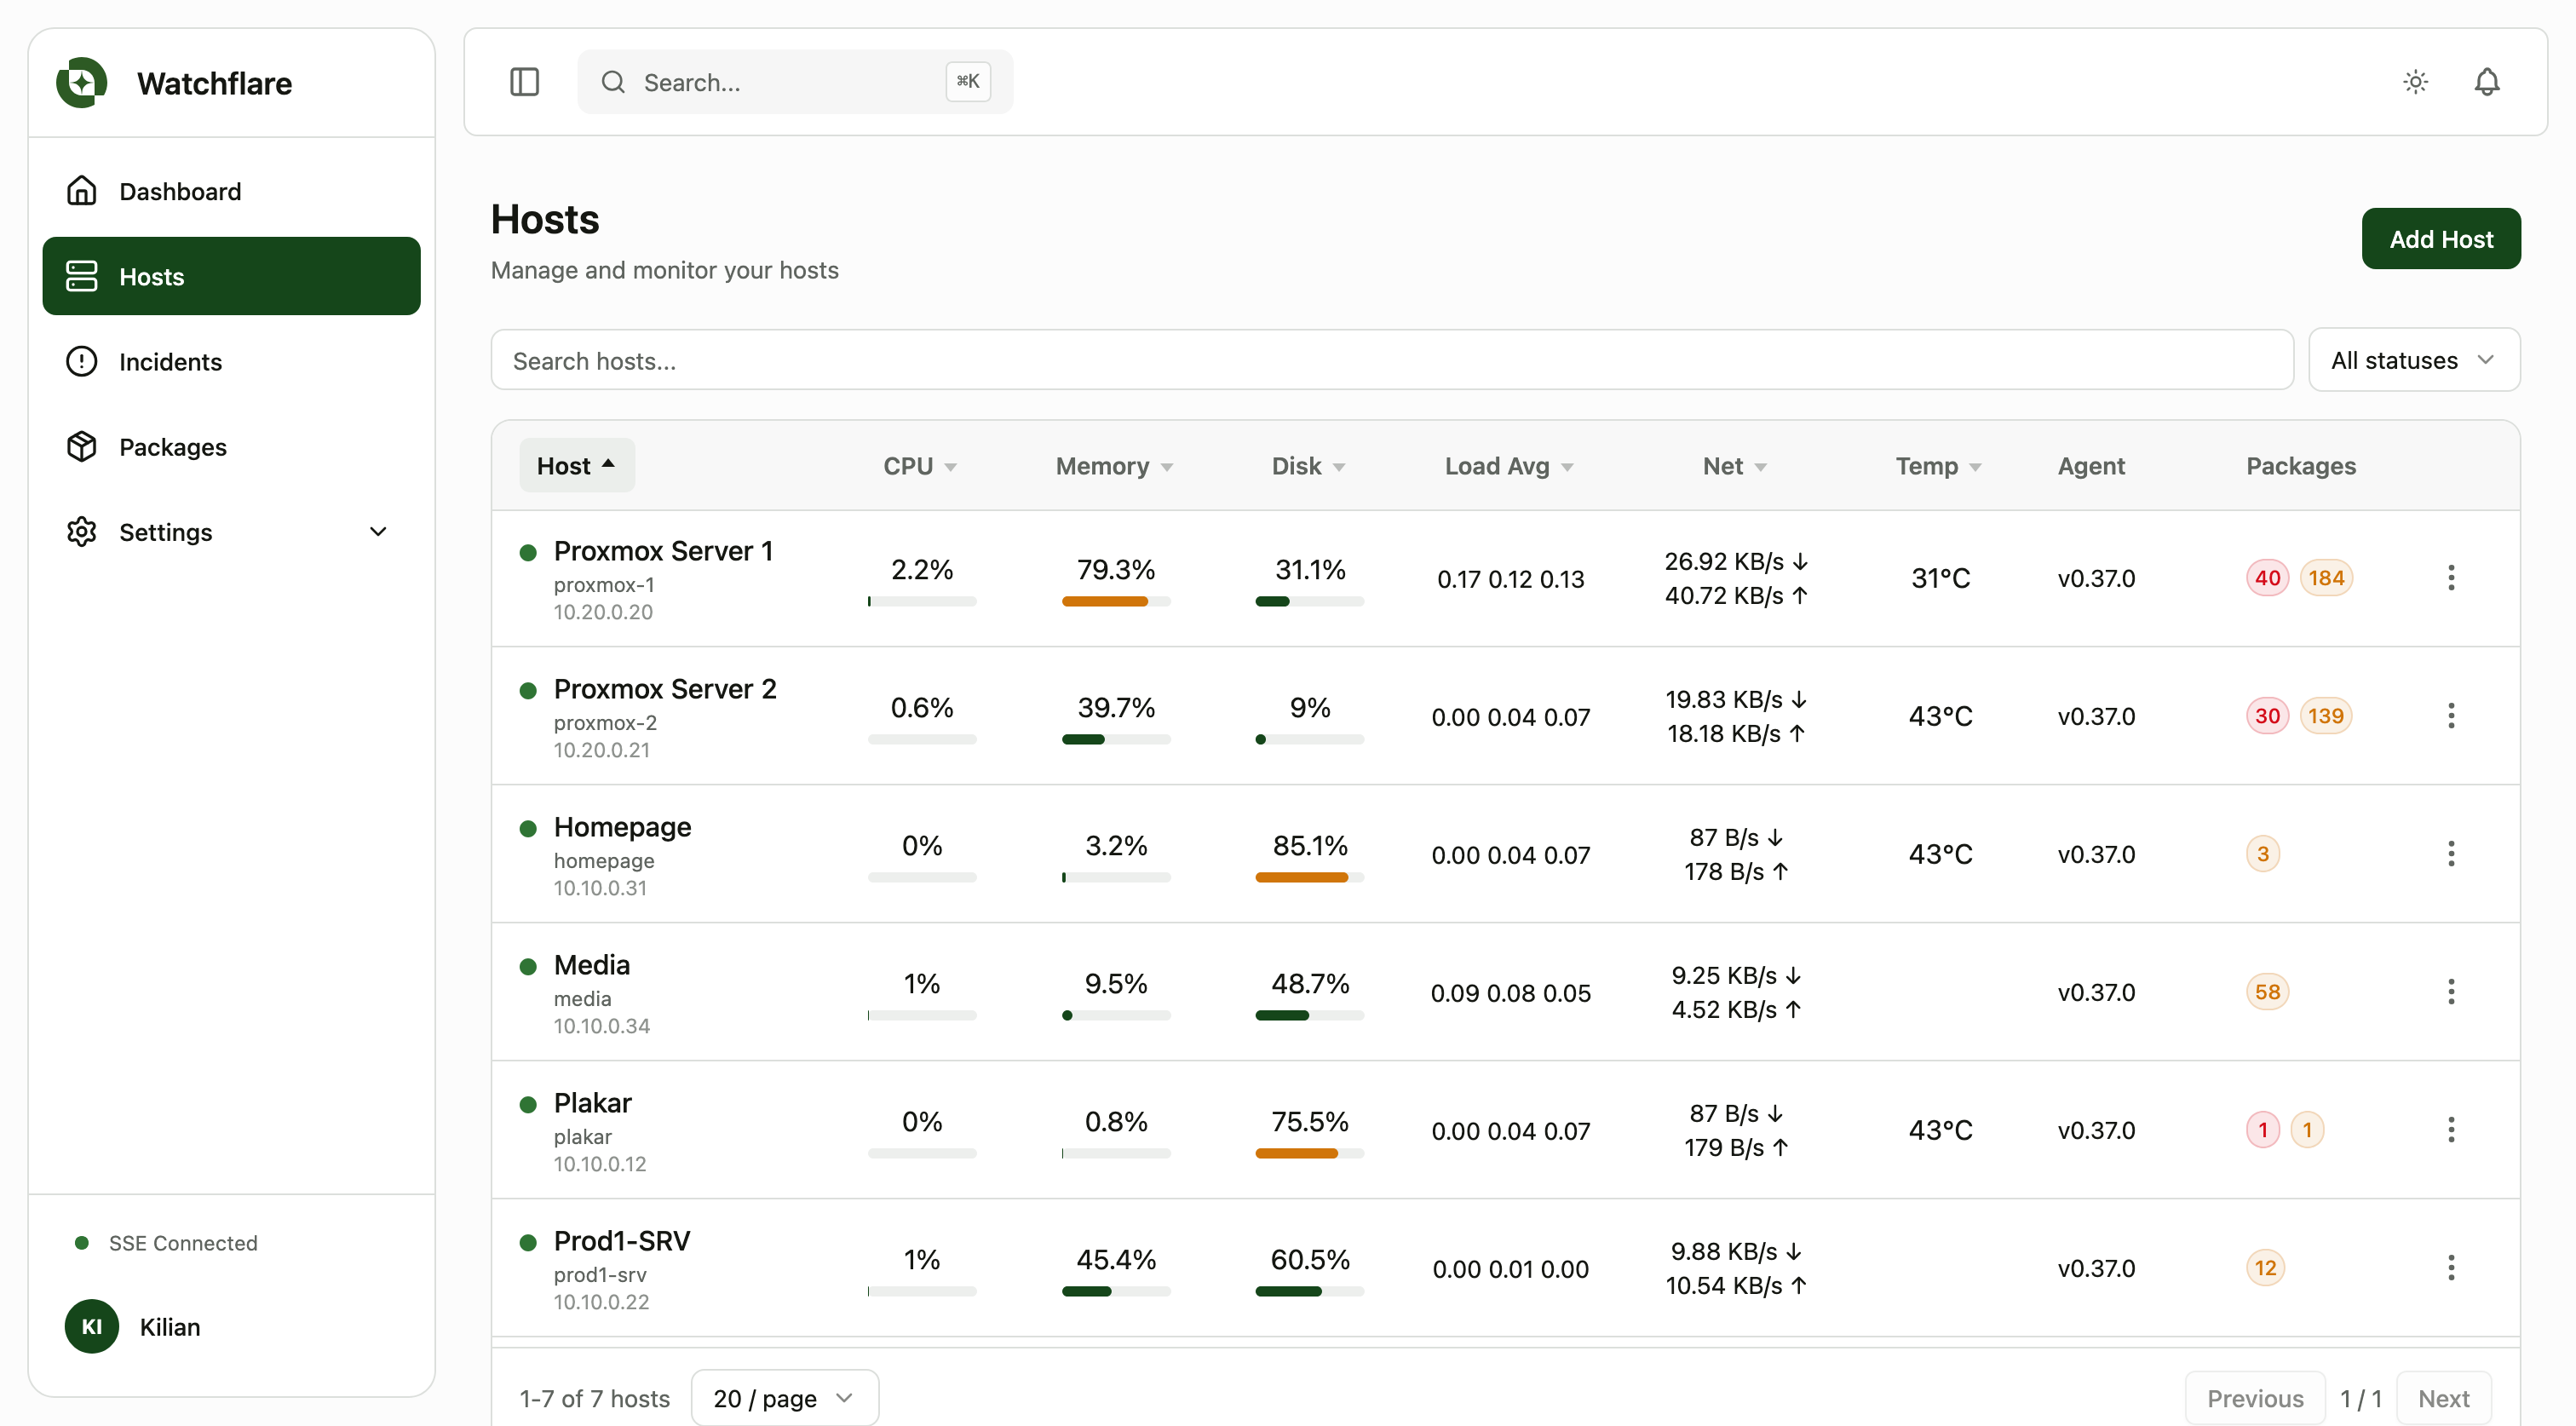
~30 package managers scanned daily. Watchflare logs every change per host and flags pending updates, security ones included, on supported managers.
Secure by default
TLS 1.3 end-to-end with auto-generated CA (or bring your own), gRPC requests with HMAC-SHA256 signatures and anti-replay, JWT sessions, bcrypt passwords.
Write-ahead log
Hub offline? The agent buffers metrics to disk and sends them in order on reconnect. No gaps within the buffer (10 MB by default, configurable).
Alerting & history
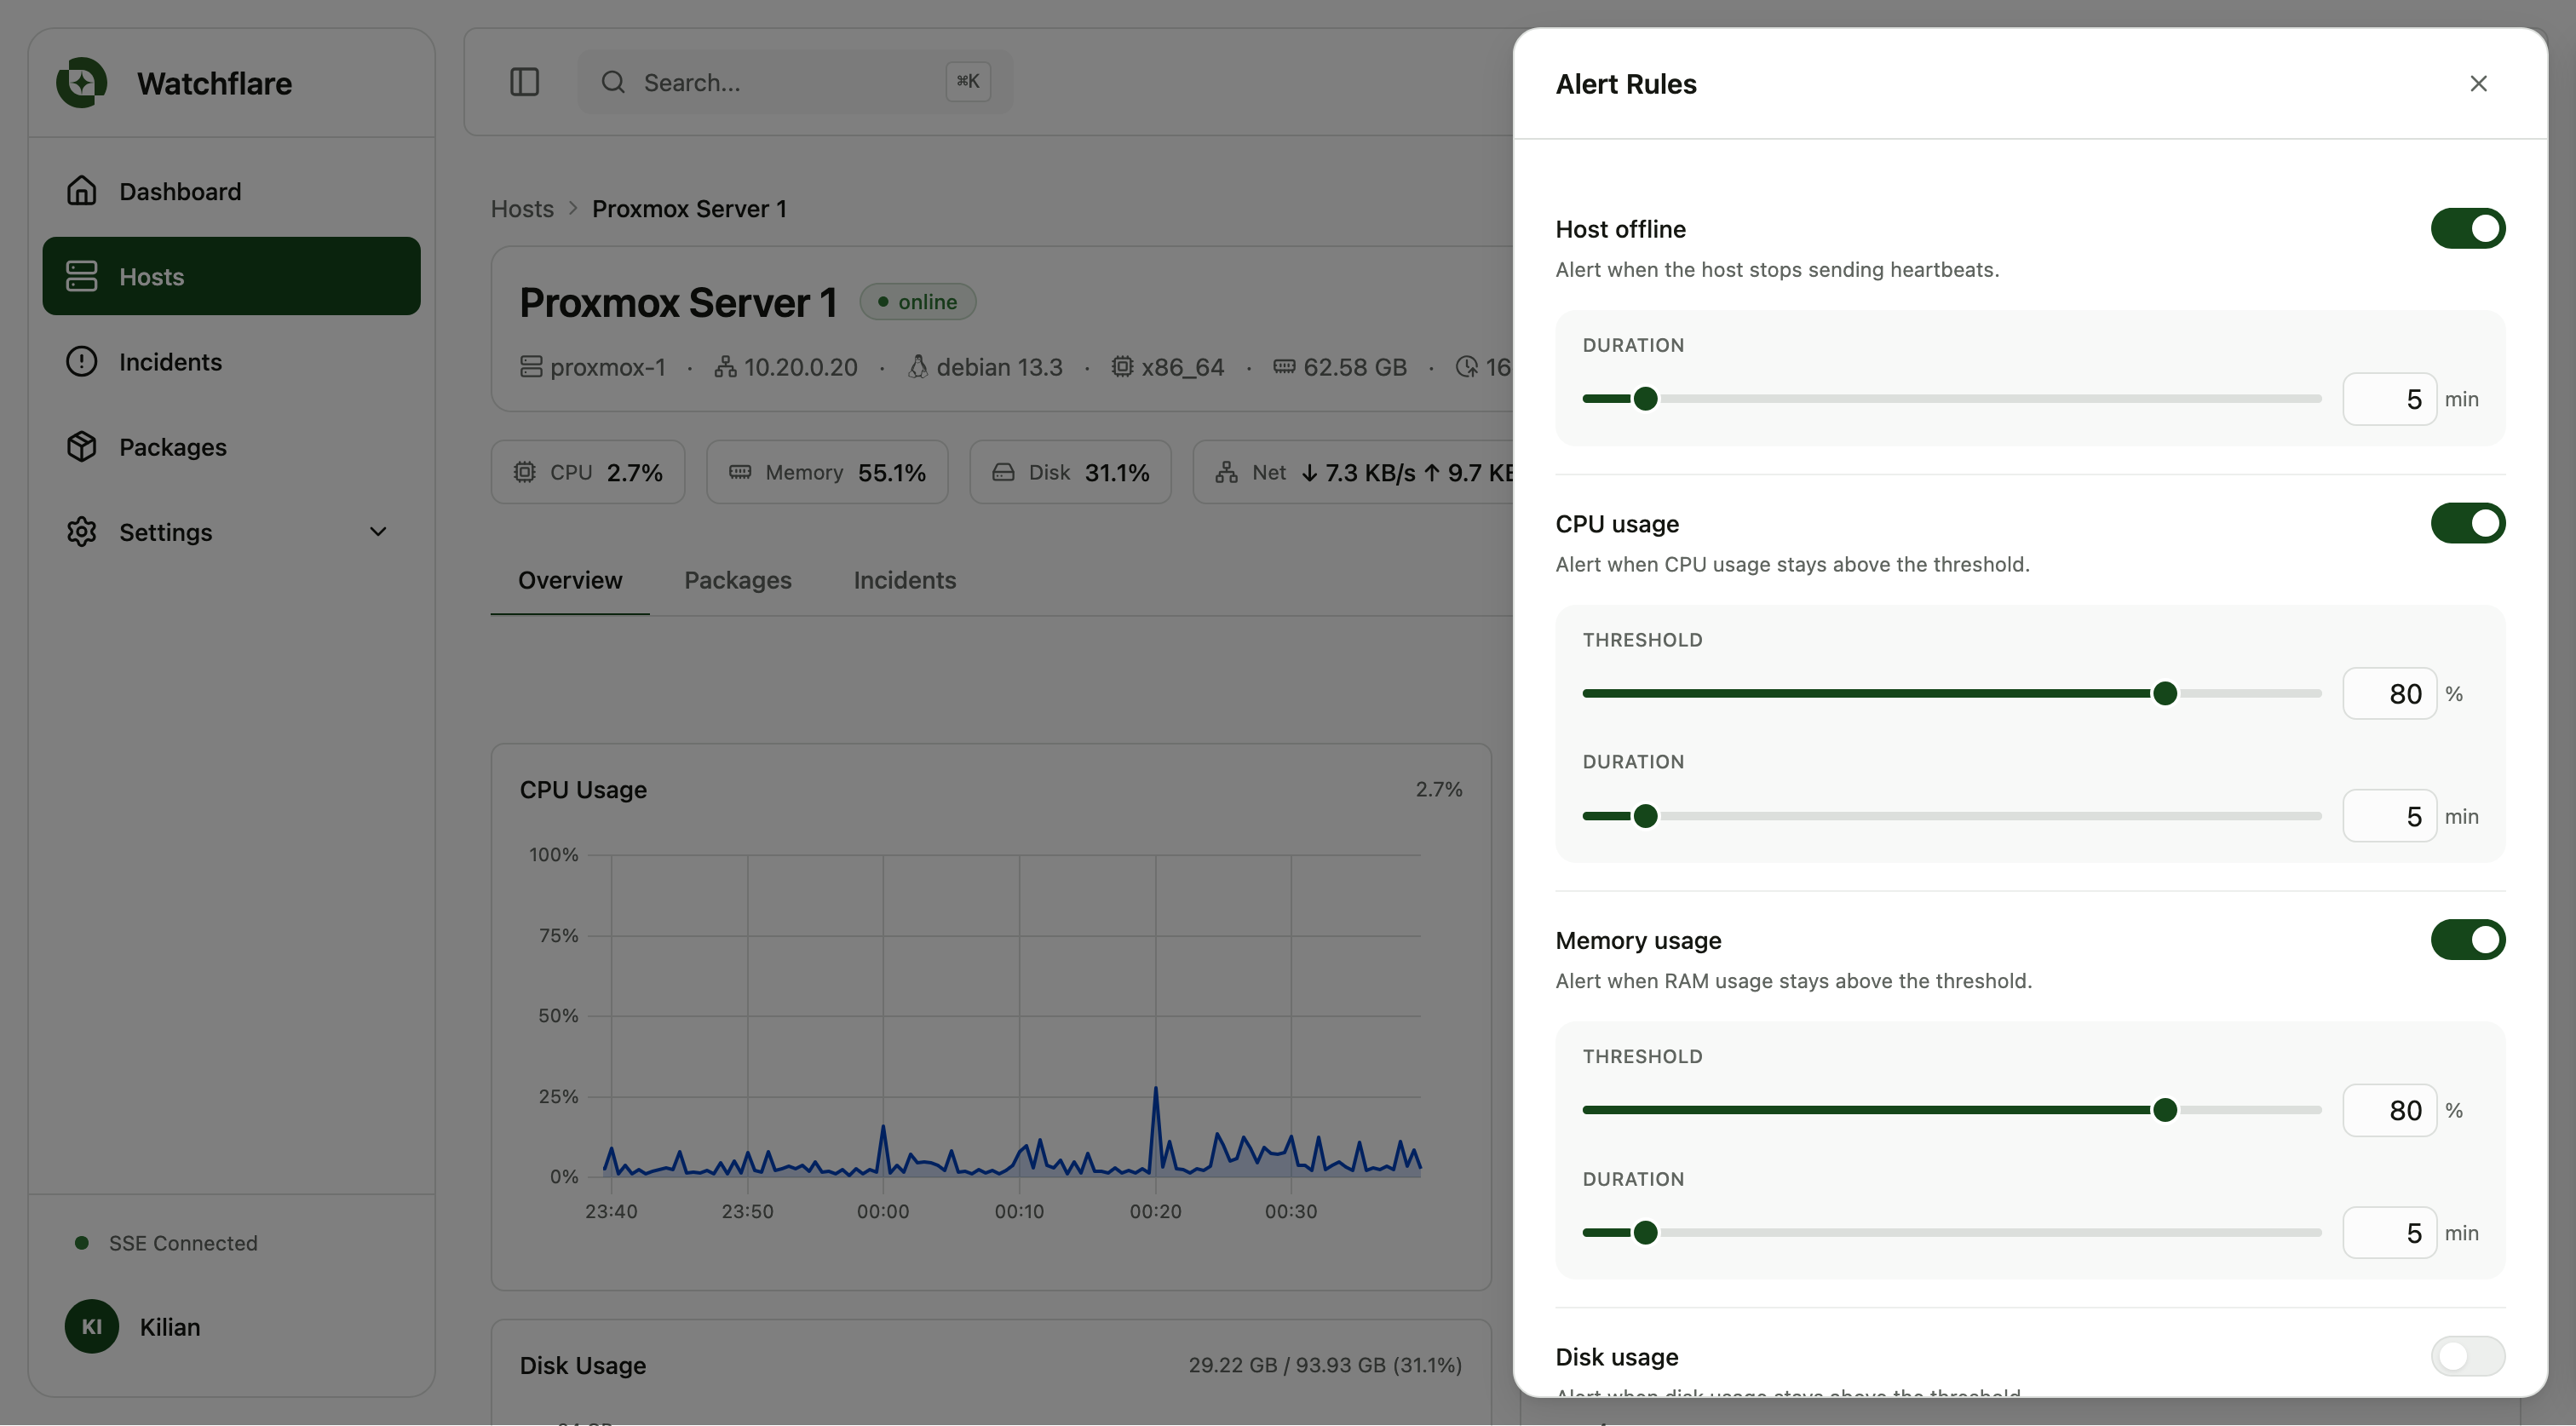
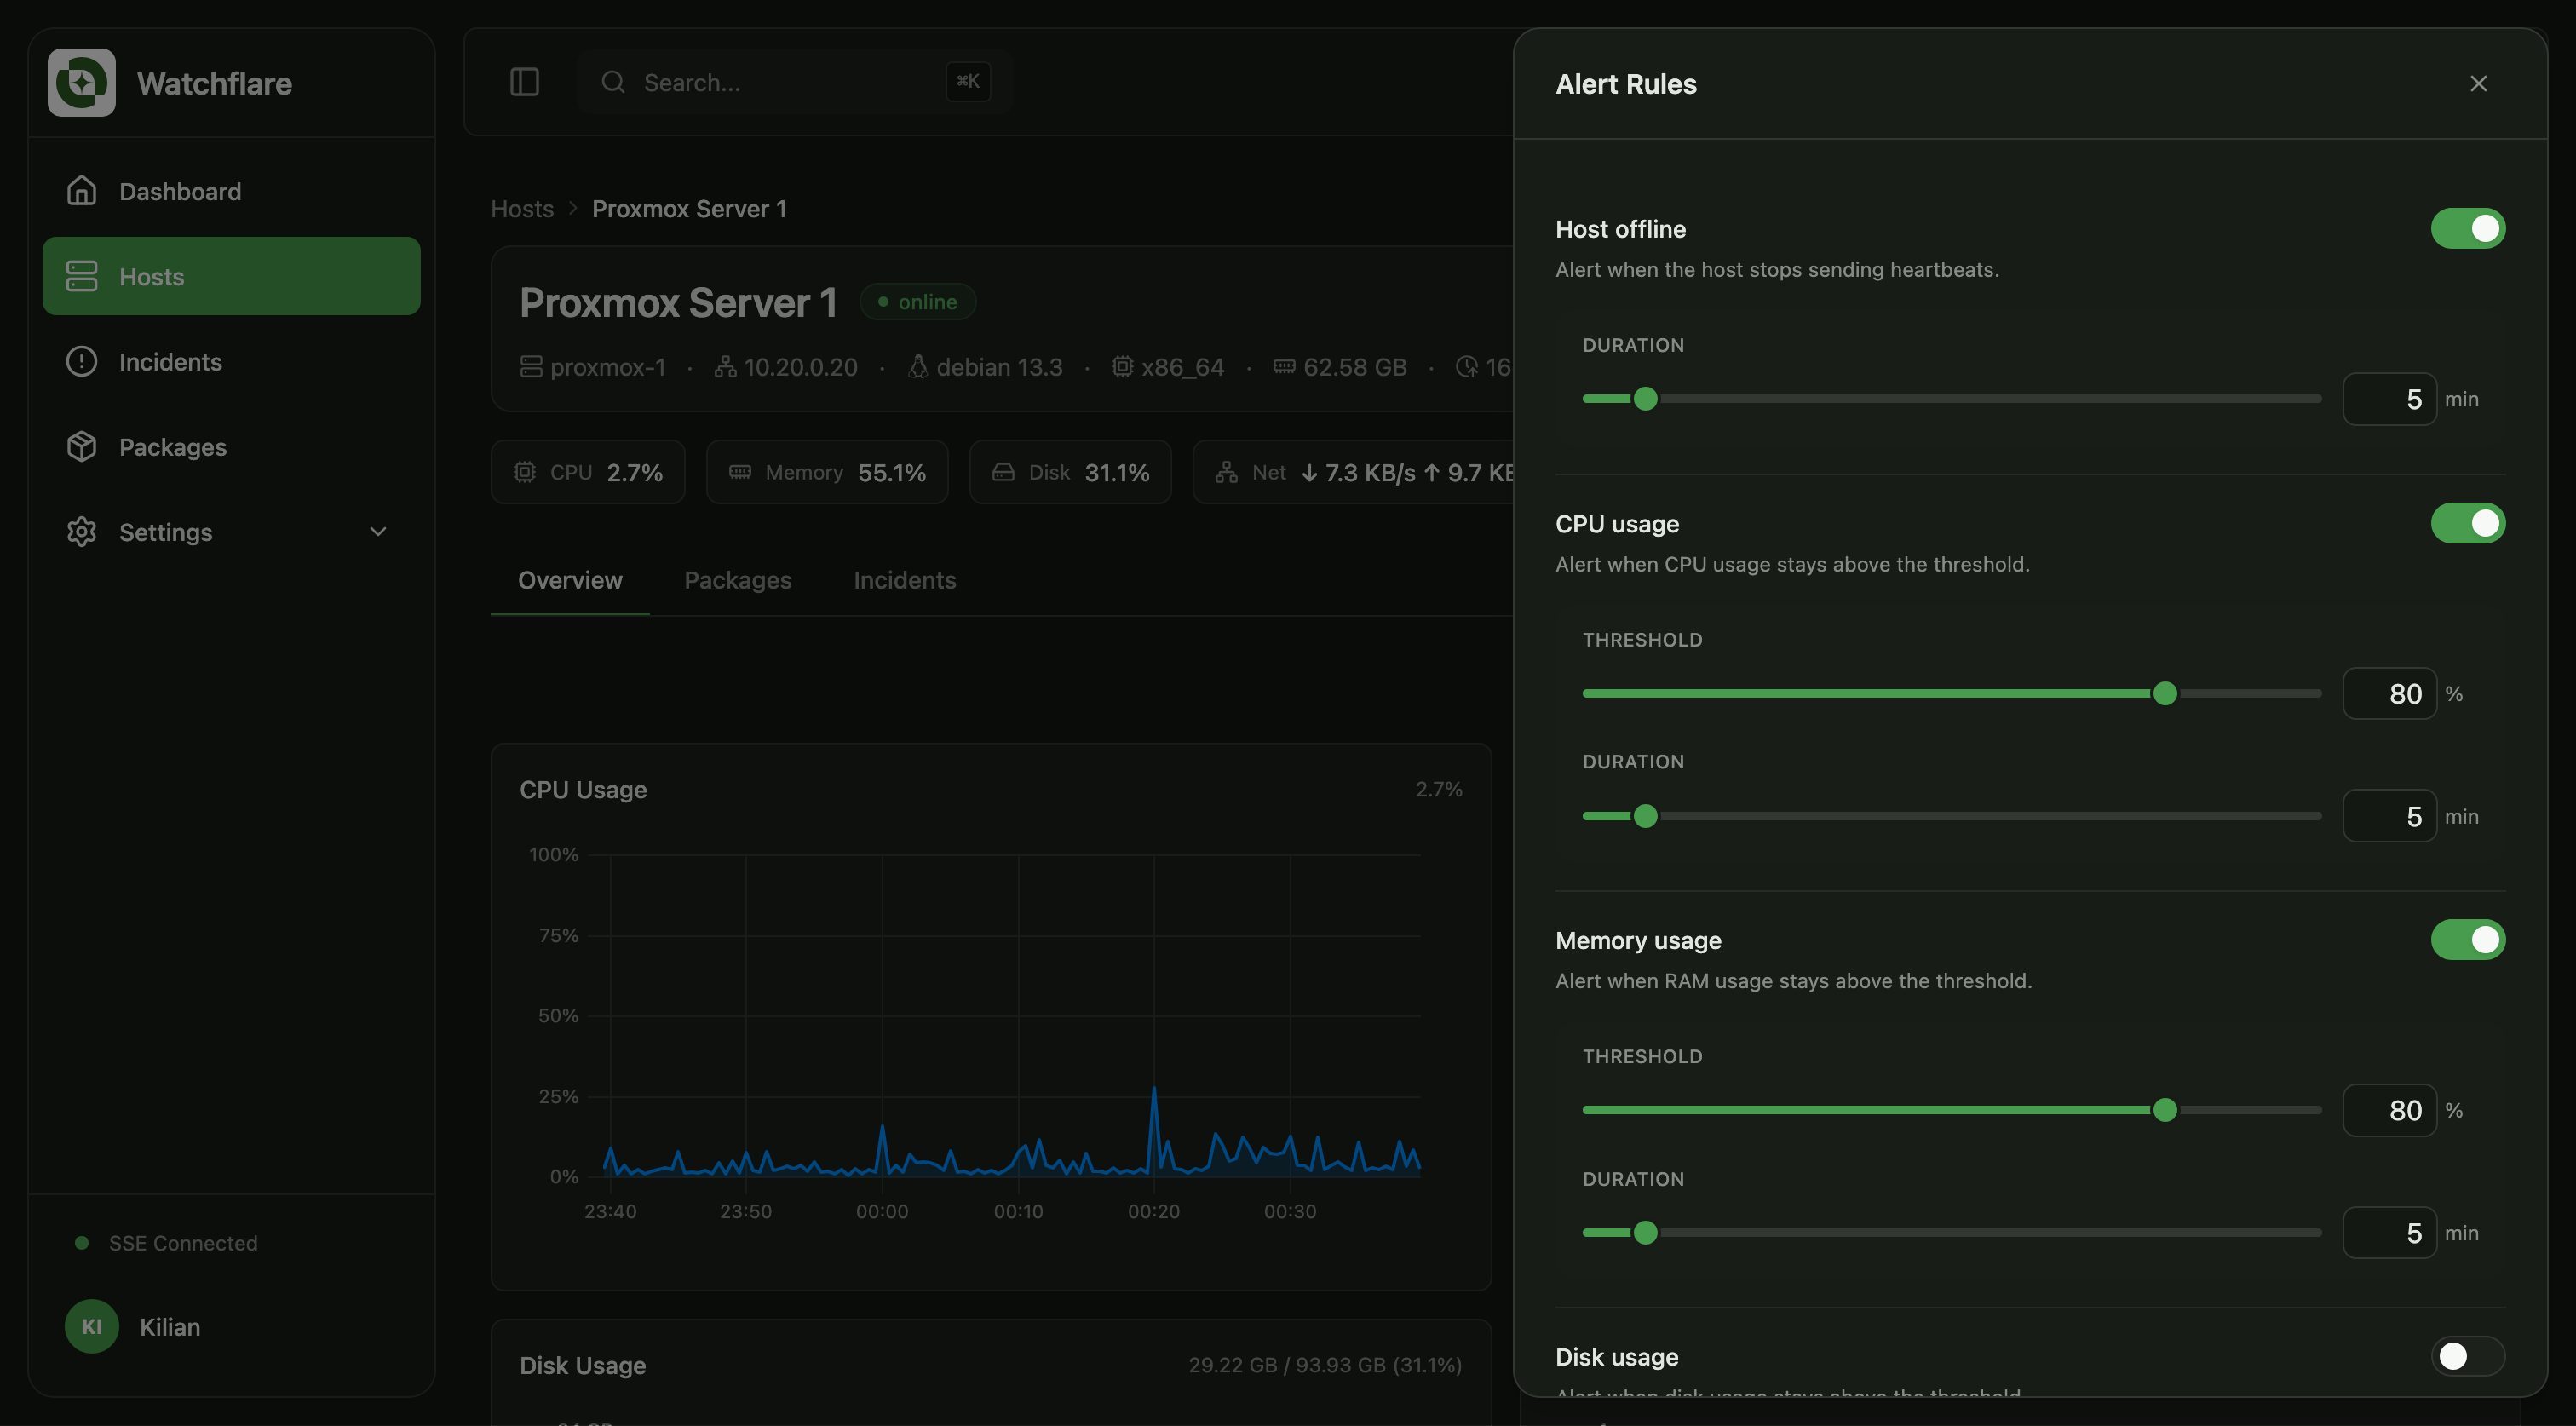
Thresholds (CPU, memory, disk, load, temperature) and host-offline detection. Alerts by email or webhook, every trigger and resolution kept per host.
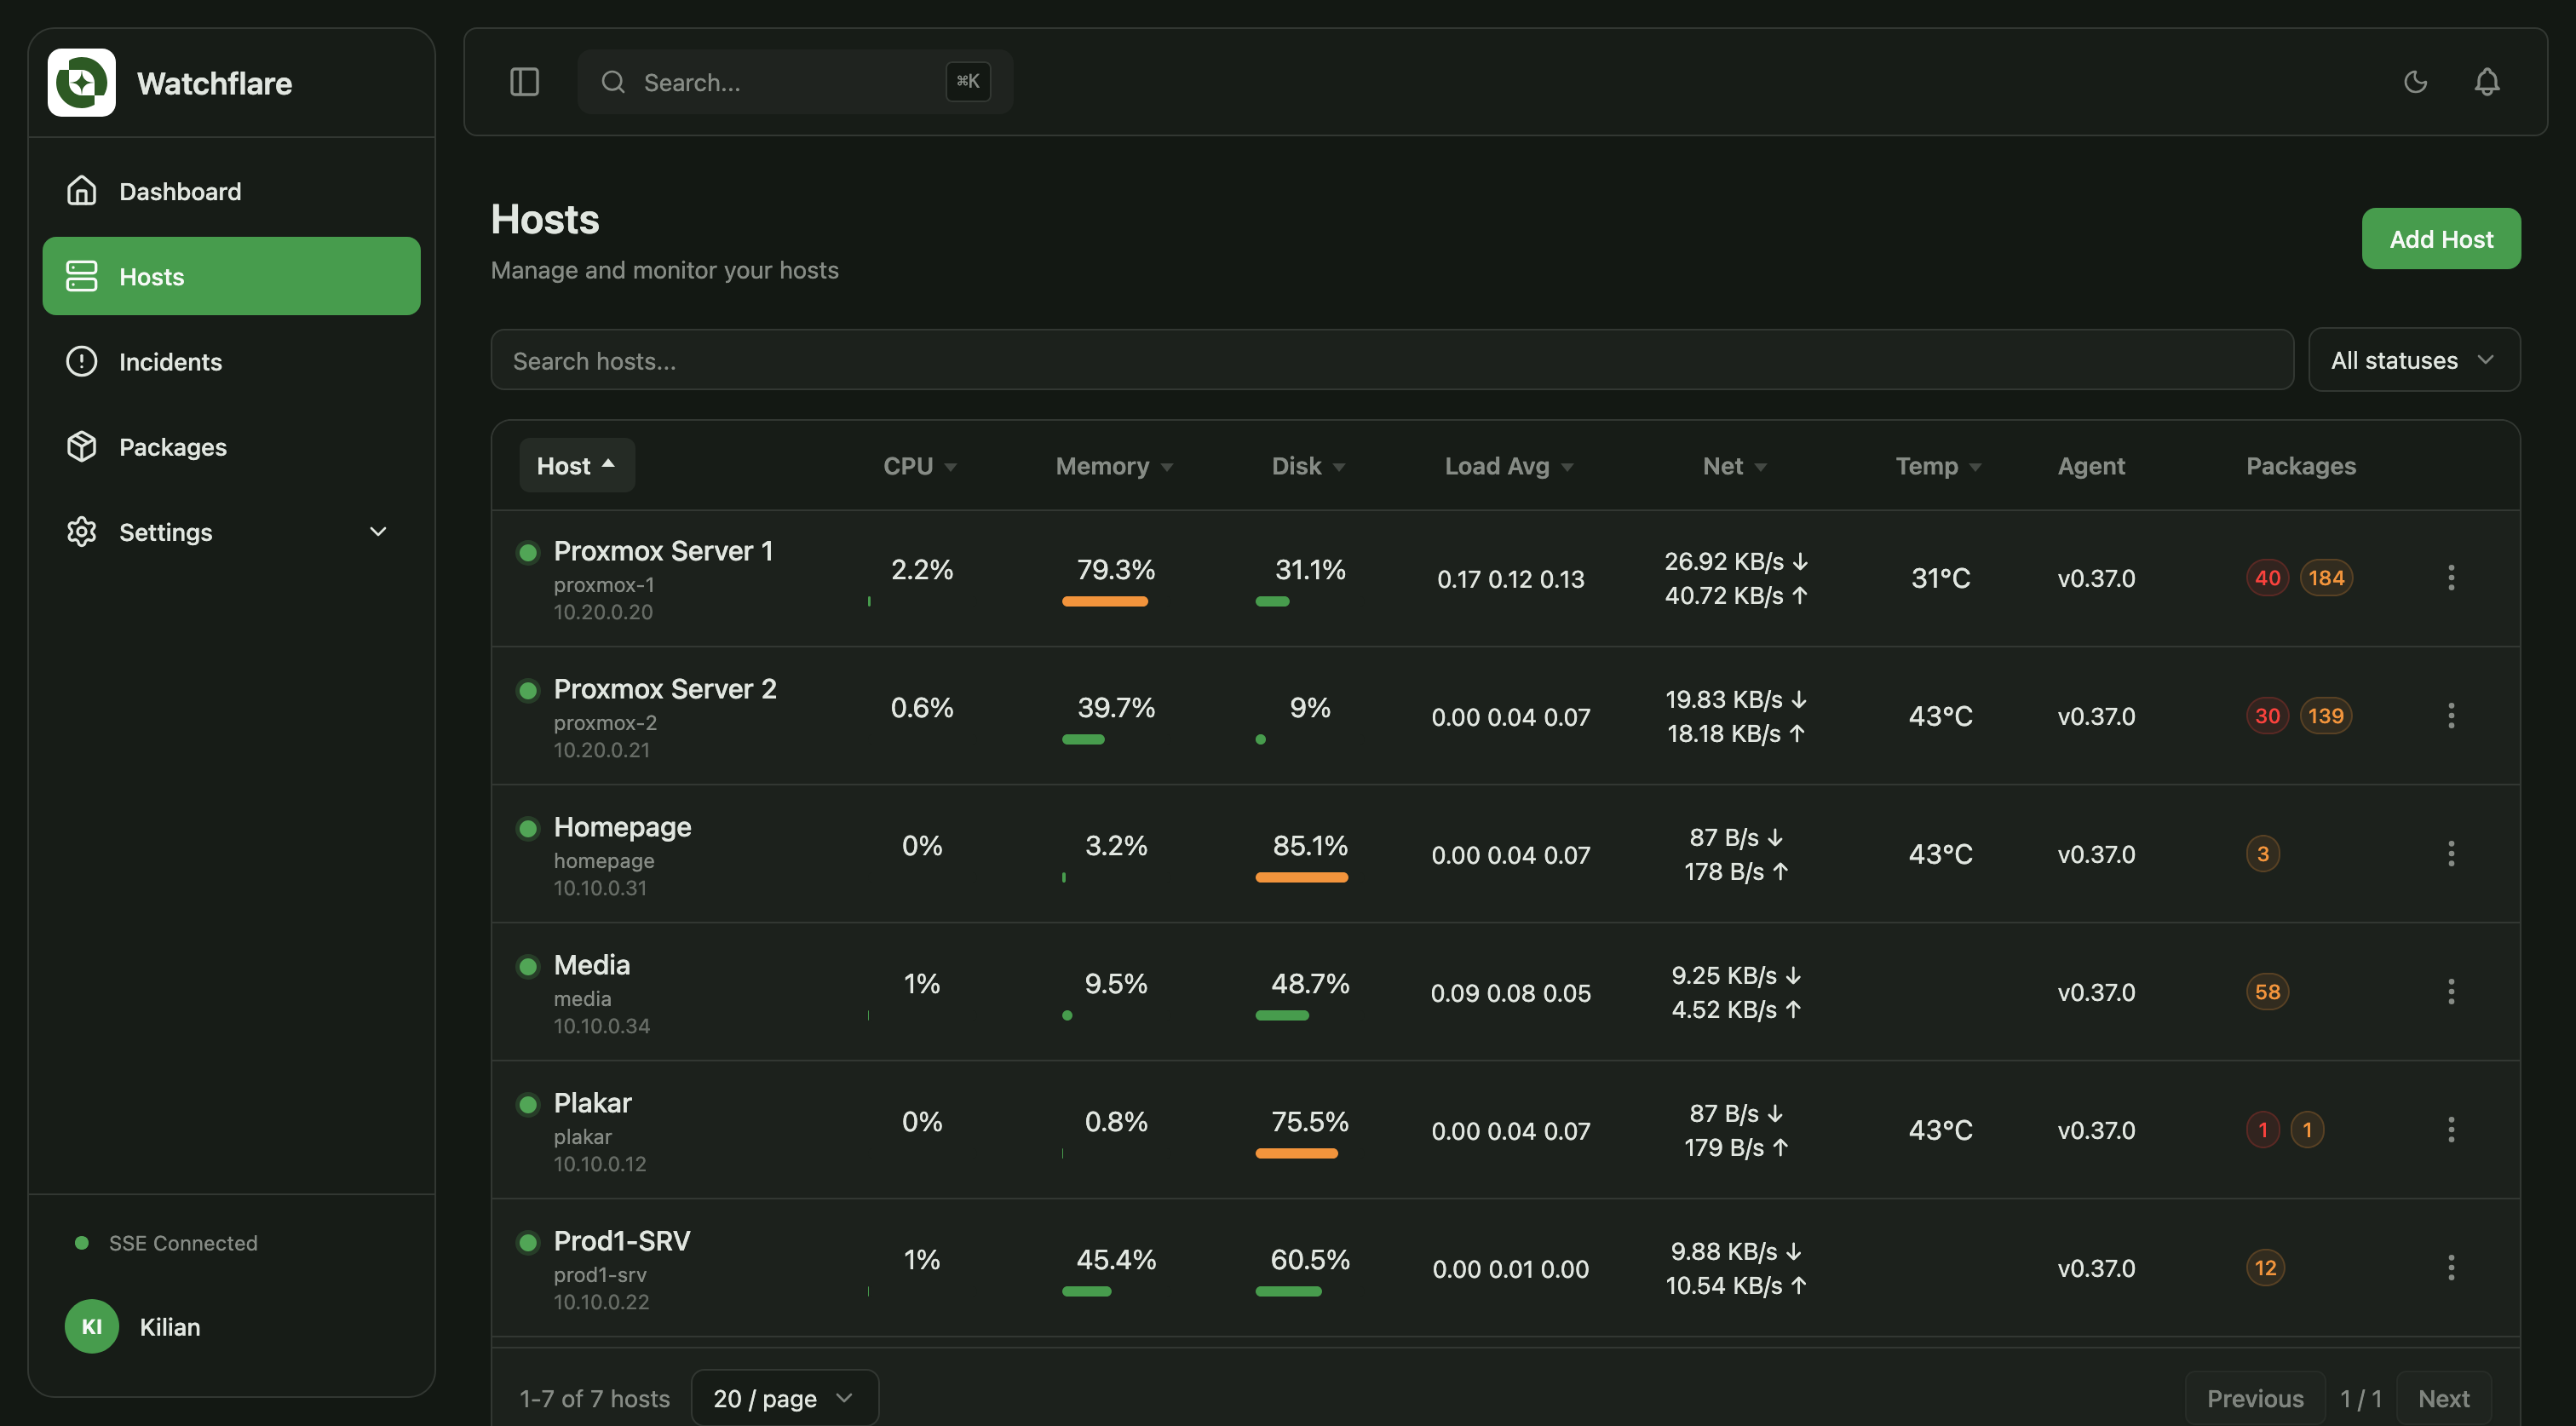
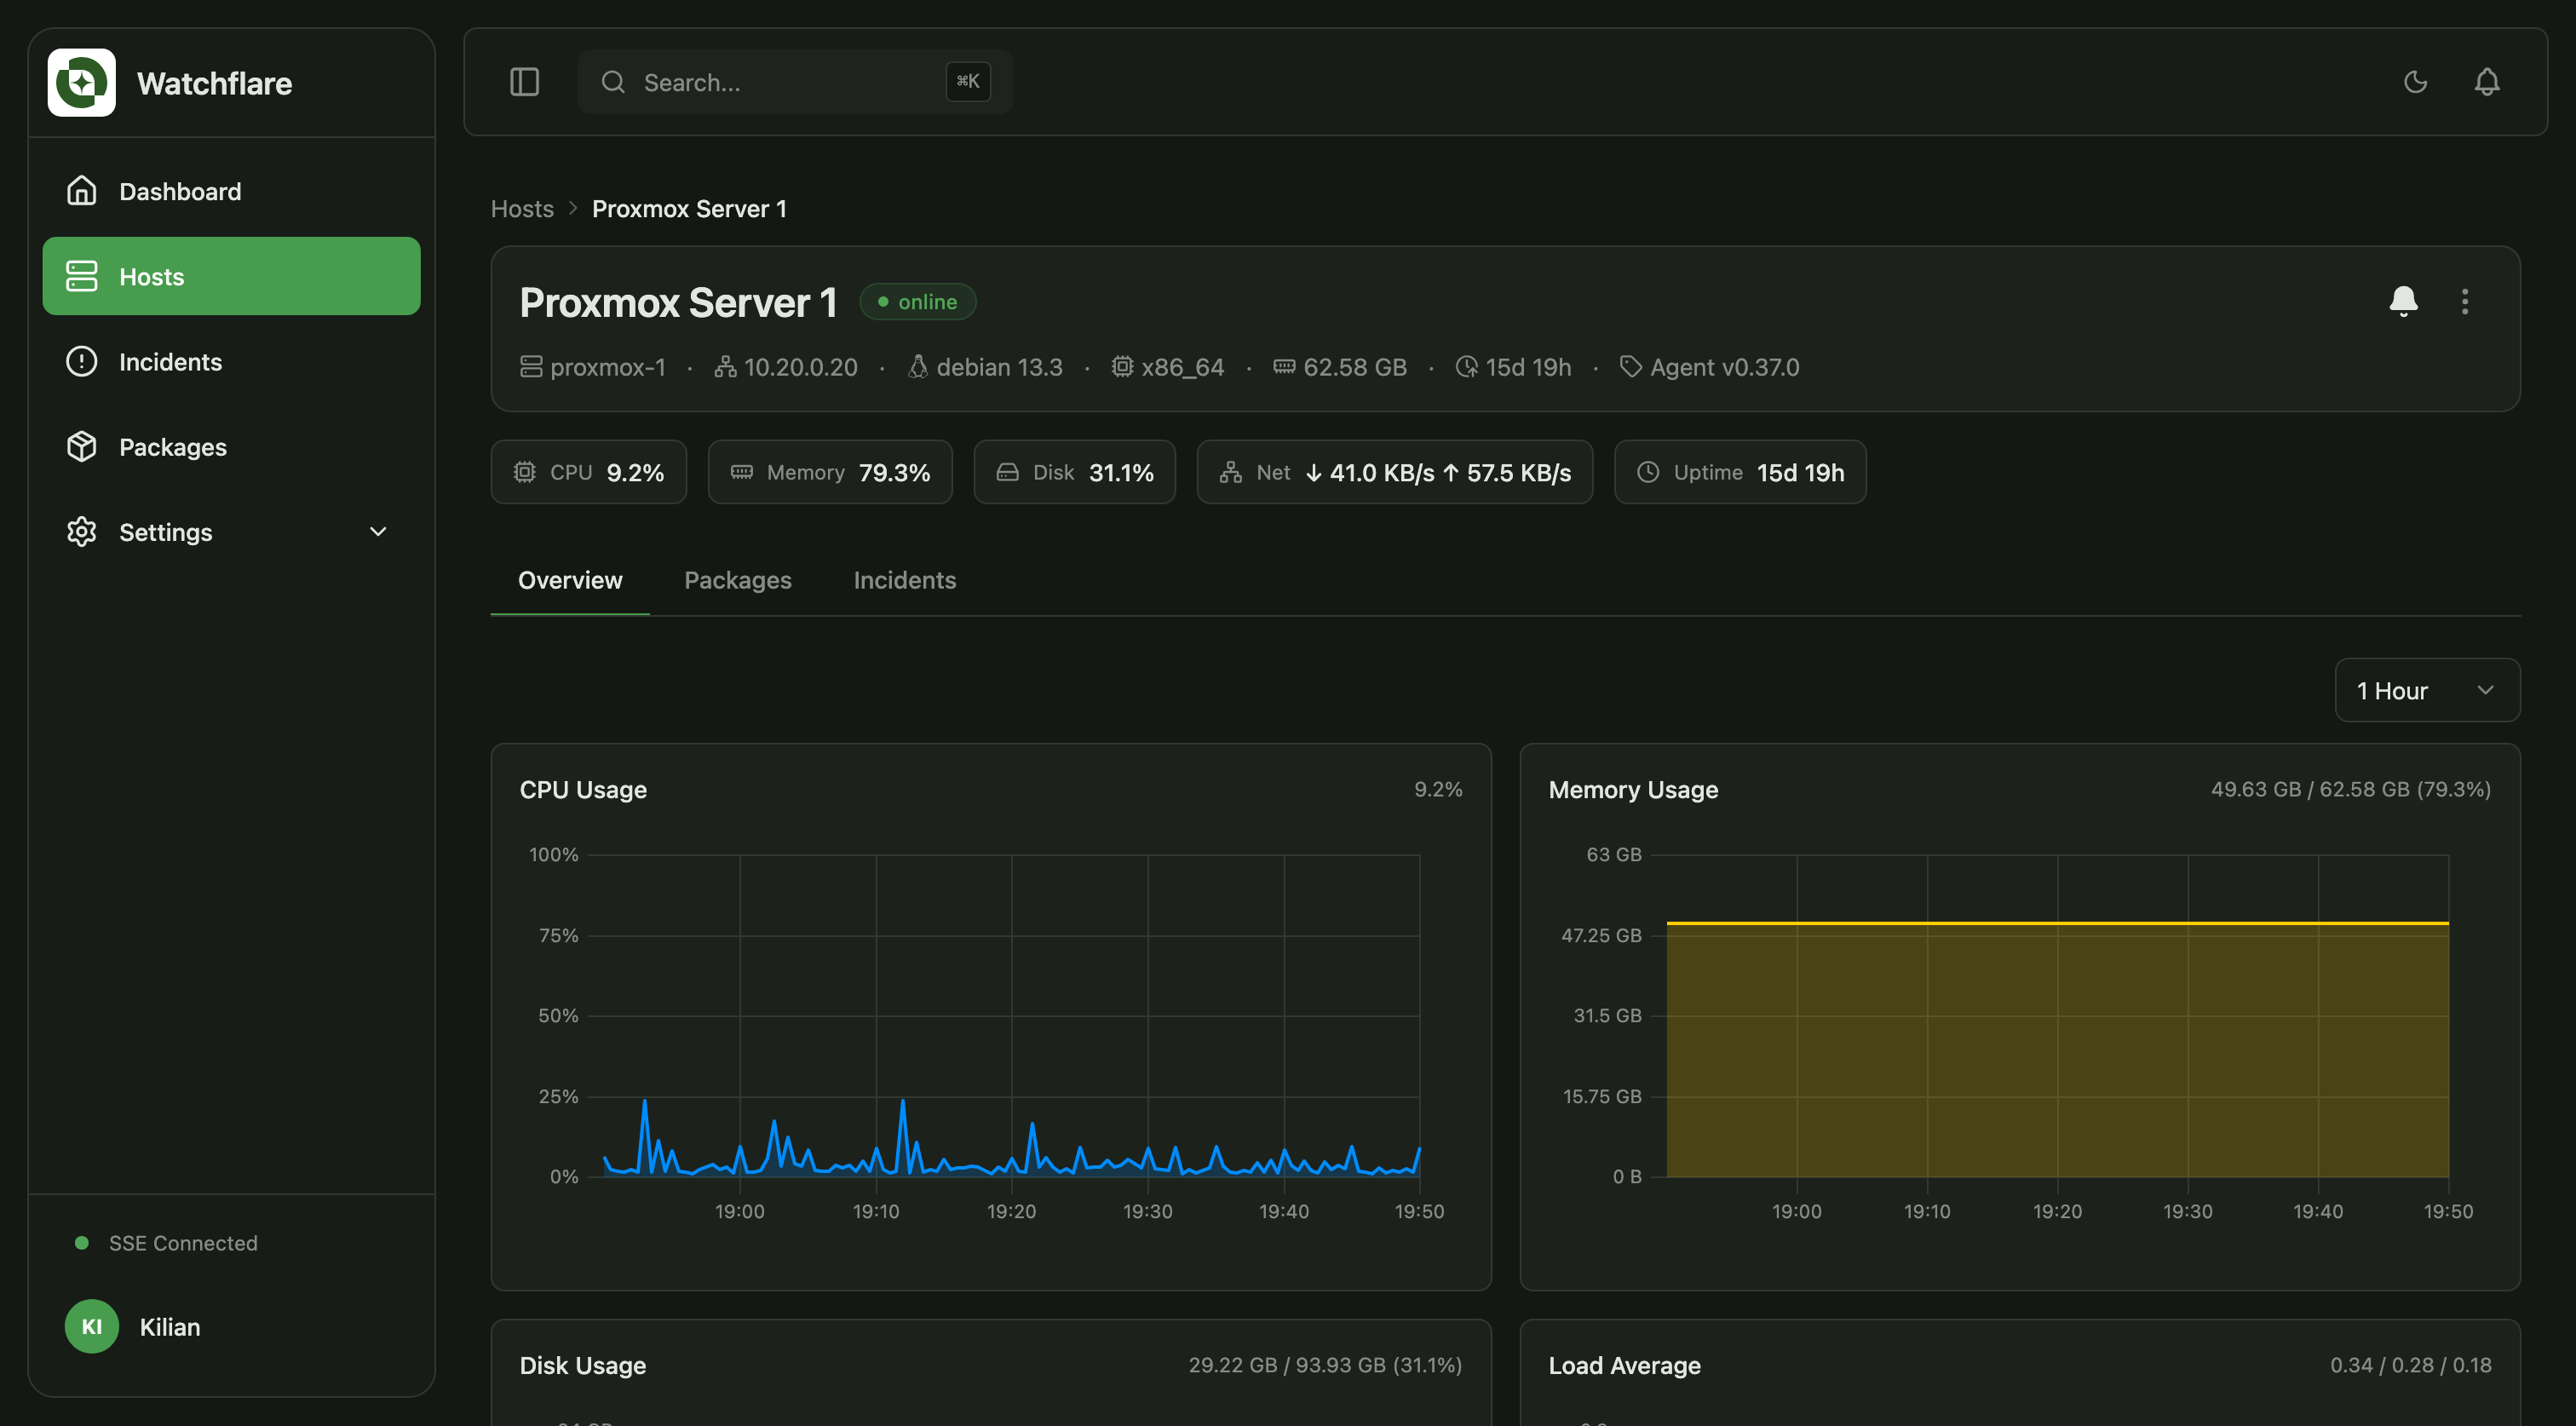
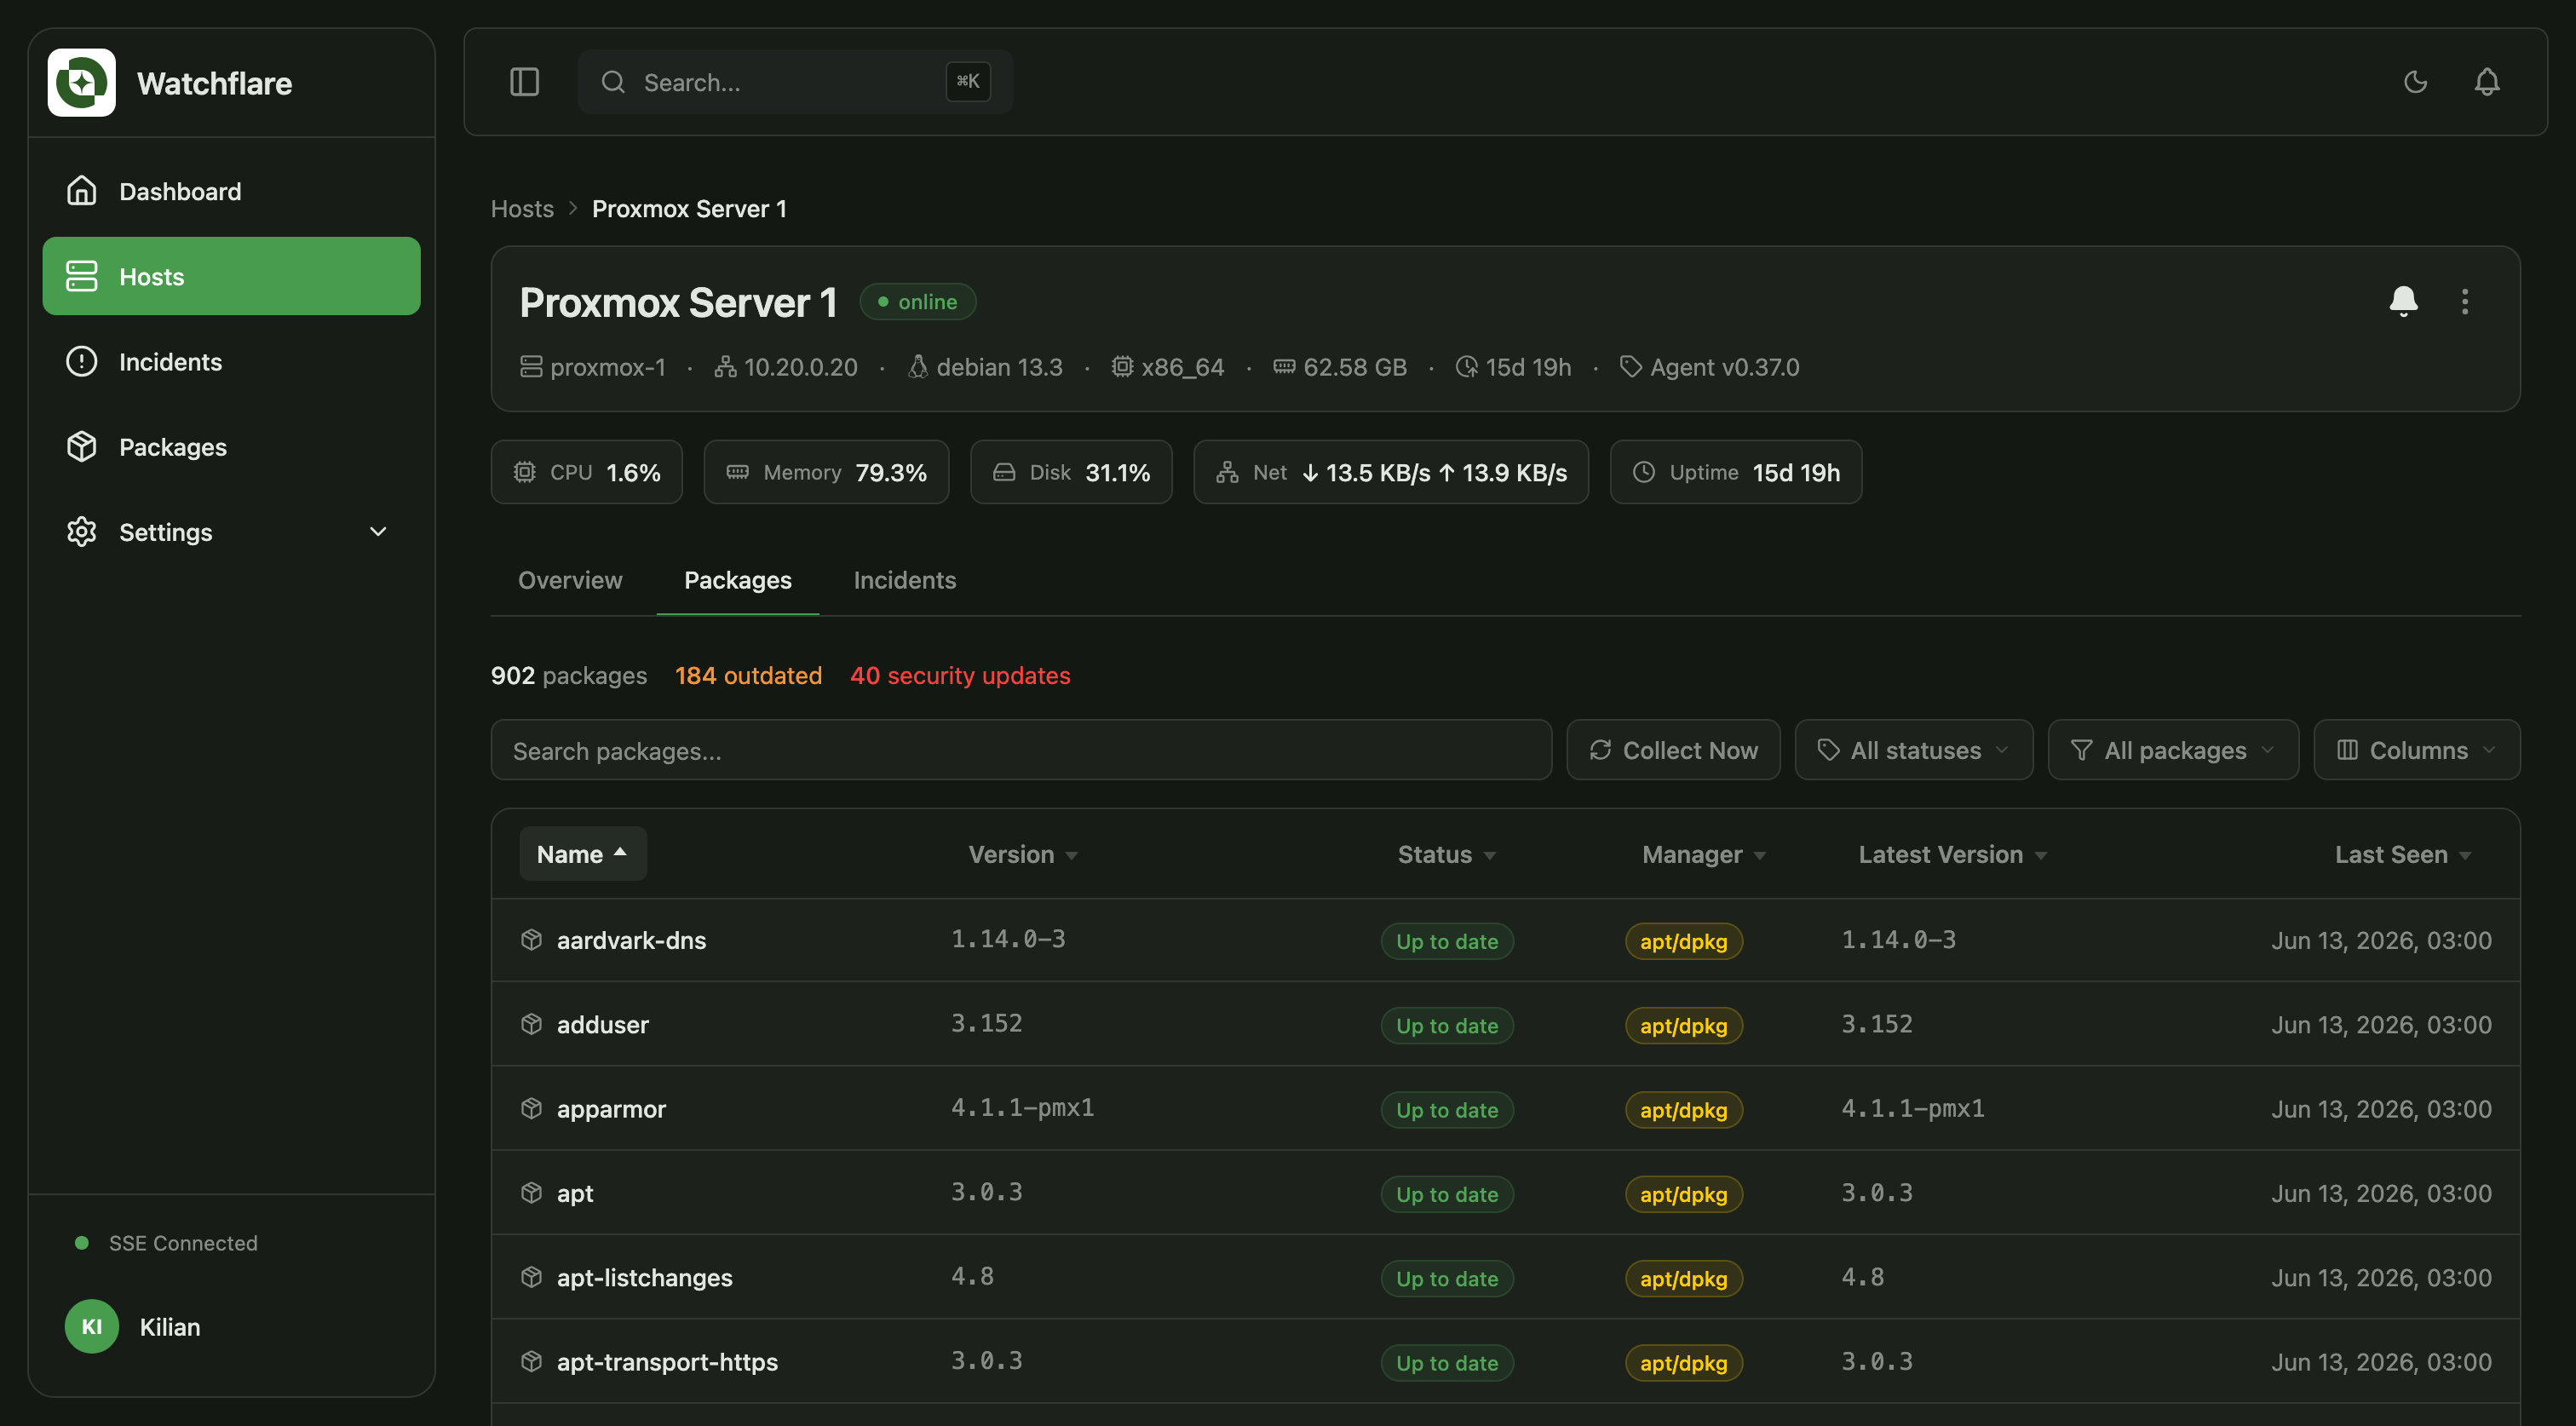
Inside the dashboard.
How it all fits together.
go:embed. Deployed via Docker Compose (or as a standalone binary).Docker for the Hub, a one-liner on each host.
Start the Hub with Docker Compose, then enroll each host with a one-time token and a copy-paste install command. Full guide at docs.watchflare.io.
Common questions about Watchflare.
Monitor your servers, simply.
Open source, self-hosted, ready to deploy.